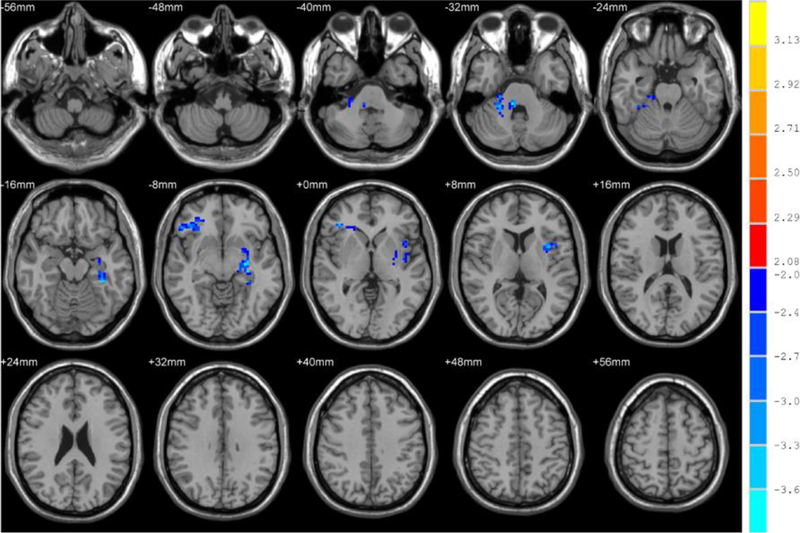
Fig. 3.

Brain regions that showed significant alterations in fALFF in the typical band (0.01–0.08 Hz) for patients before and after ECT. For display purposes only, all statistical maps are overlaid on a T1-weighted MNI template. The blue cold color denotes post-ECT < pre-ECT and T-score bars are shown on the right side. The brain regions with significant decreases in fALFF include the cerebellum lobe, parahippocampal gyrus, fusiform gyrus, middle frontal lobe, and inferior frontal gyrus.
