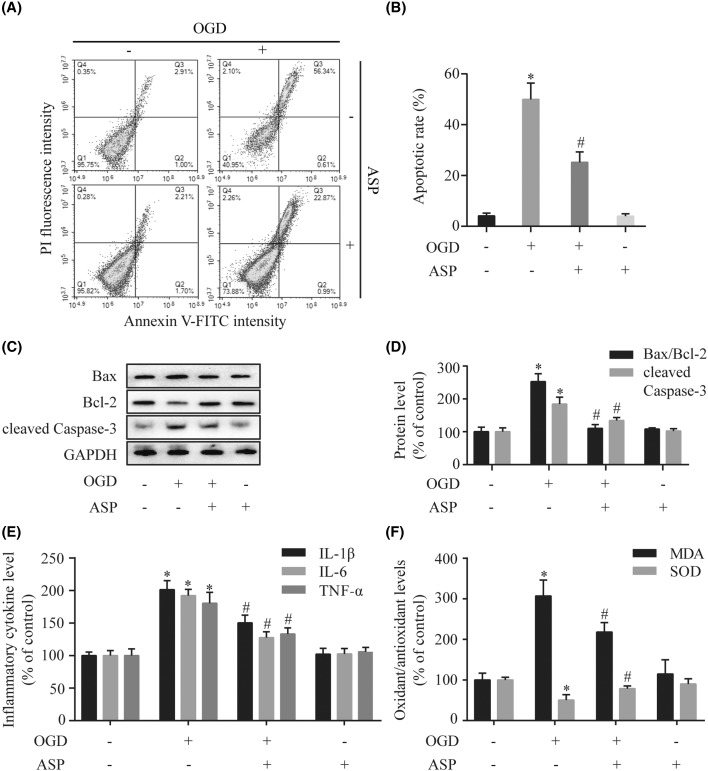
Figure 2. ASP protects H9c2 cells against OGD-induced apoptosis, inflammation, and oxidative stress.
(A) Representative images of flow cytometric analysis by Annexin V-FITC/PI staining. (B) Apoptotic cells are represented as the percentage of Annexin V-positive cells. The expression levels of cleaved Caspase-3, Bax, and Bcl-2 were detected by Western blot (C), and densitometry (D) analyses. (E) The levels of proinflammatory cytokines (IL-1β, IL-6, and TNF-α) were analyzed by ELISA. (F) The levels of oxidative stress markers (MDA and SOD) were detected by the respective assay kits. *P<0.05 compared with the control group; #P<0.05 compared with the OGD-treated group.

