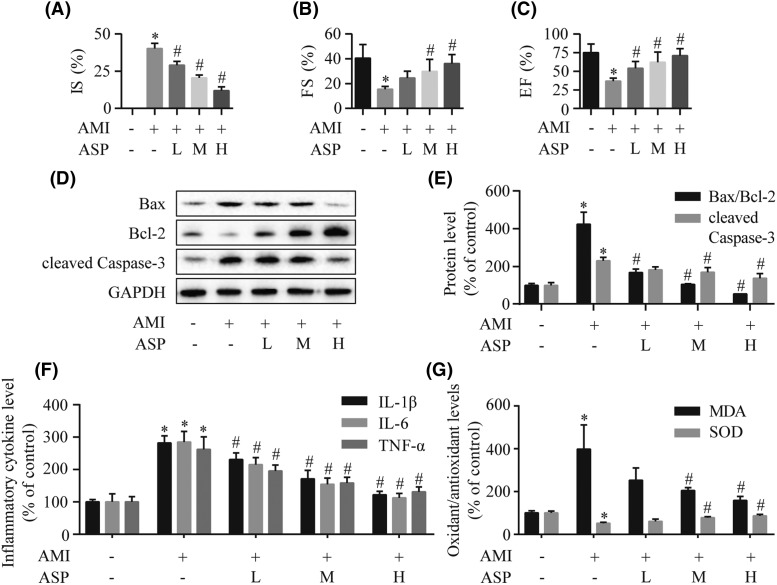
Figure 5. ASP exerts cardioprotection on rats subjected to AMI.
(A) The quantitative analysis of myocardial infarct size (IS) detected by TTC staining. (B,C) Echocardiographic assessment of cardiac systolic function indicated by LV FS and EF. The expression levels of cleaved Caspase-3, Bax, and Bcl-2 were assessed by Western blot (D) and densitometry (E) analyses. (F) ELISA measurement of IL-1β, IL-6, and TNF-α levels in serum. (G) The concentrations of MDA and SOD in myocardial tissue. *P<0.05 compared with the sham group; #P<0.05 compared with the AMI group.

