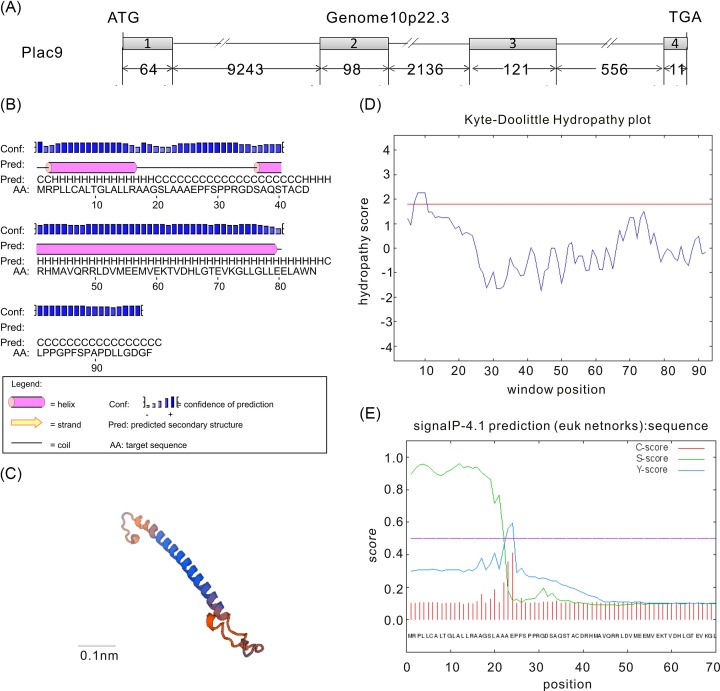
Figure 1. Genomic structure, protein structure, and bioinformatic analysis of Plac9.
(A) The genomic information of Plac9. Gray boxes and dark lines denote exons and introns, respectively. The start codon (ATG) and stop codon (TGA) of protein translation are labeled. The numbers underneath represent nucleotide length. (B) The secondary structure prediction of Plac9. The gray columns and dark lines depict helices and coils, respectively. (C) The tertiary structure prediction of Plac9. Scale bar is 0.1 nm. (D) The signal peptide prediction of Plac9. The x-axis and y-axis represent the number of amino acid residues and the possibility of cleavage, respectively. (E) The hydropathy plot of Plac9. The x-axis and y-axis indicate the number of amino acid residues and hydrophobicity, respectively.

