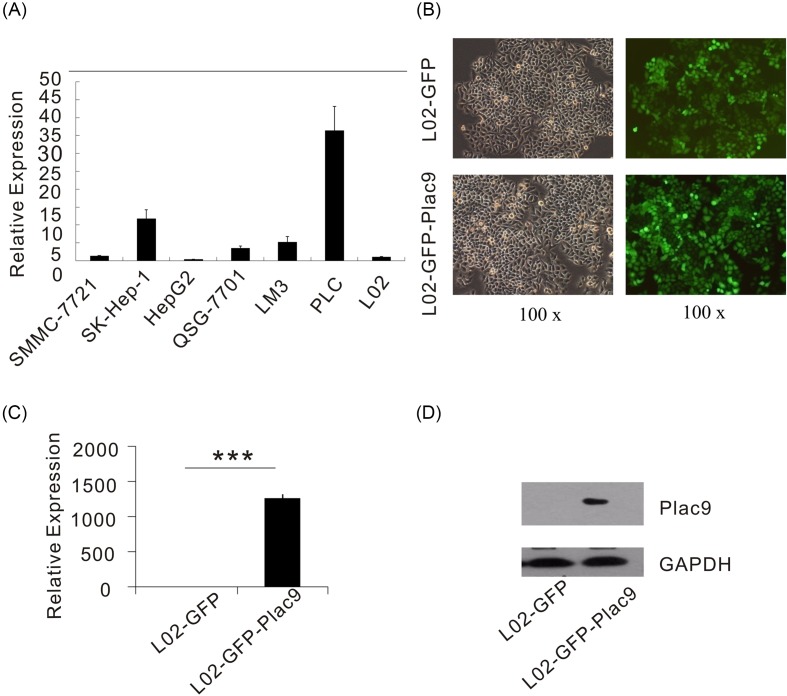
Figure 3. The expression pattern of Plac9 in hepatic cell lines and the generation of stable Plac9-expressing L02 cells via lentiviral transduction.
(A) The relative mRNA expression level of Plac9 in SMMC-7721, SK-HEP-1, HEP-G2, QSG-7701, Lm3, PLC, L02 cells. (B) Detection of GFP via fluorescence microscopy after the lentiviral infection (green, Plac9; ×100 view) Left panel: bright sight. Right panel: dark sight. (C) The relative mRNA expression levels of Plac9 in L02-GFP and L02-GFP-Plac9 cells after the lentiviral infection. (D) Protein expression levels of Plac9 in L02-GFP and L02-GFP-Plac9 cells after the lentiviral infection. GAPDH served as an internal control. ***P<0.001.

