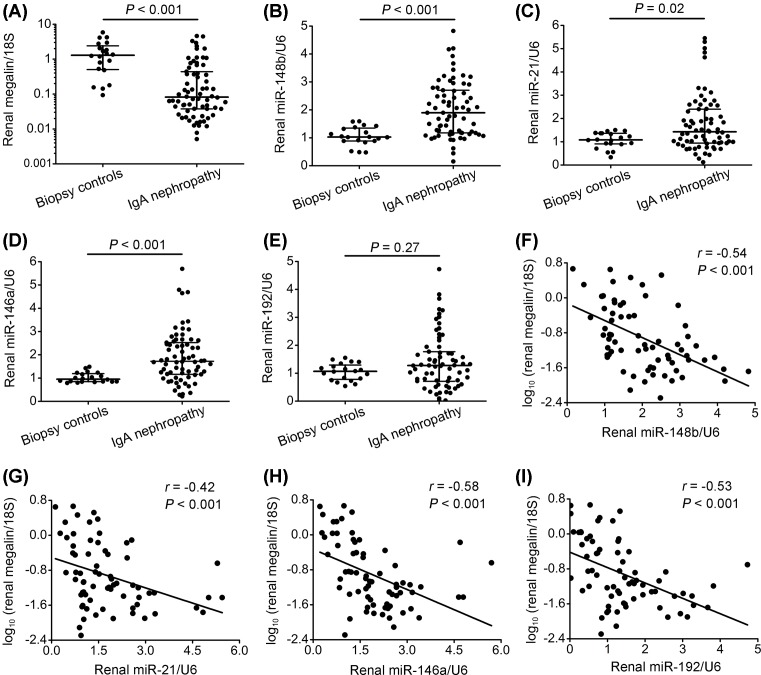
Figure 1. Megalin mRNA as well as miR-148b, miR-21, miR-146a, and miR-192 expression in kidney tissue from patients with IgAN.
(A) Megalin mRNA levels were decreased by 94% when compared with biopsy controls. (B–E) In contrast, levels of miR-148b, miR-21, and miR-146a were increased by 85%, 32%, and 80%, respectively, while a non-significant trend of increased miR-192 was observed in IgAN patients when compared with biopsy controls kidney tissue. (F–I) Megalin mRNA expression correlated inversely with levels of miR-148b, miR-21, miR-146a, and miR-192 in patients with IgAN. Renal megalin mRNA, miR-148b, miR-21, miR-146a, and miR-192 levels were detected by qPCR and normalized to 18S and U6, respectively. IgAN, n=70; biopsy controls, n=20. The horizontal lines (A–E) from top down represent 75th percentile, median, and 25th percentile; the vertical lines represent interquartile range. Megalin mRNA levels were logarithmically transformed to fit a normal distribution.

