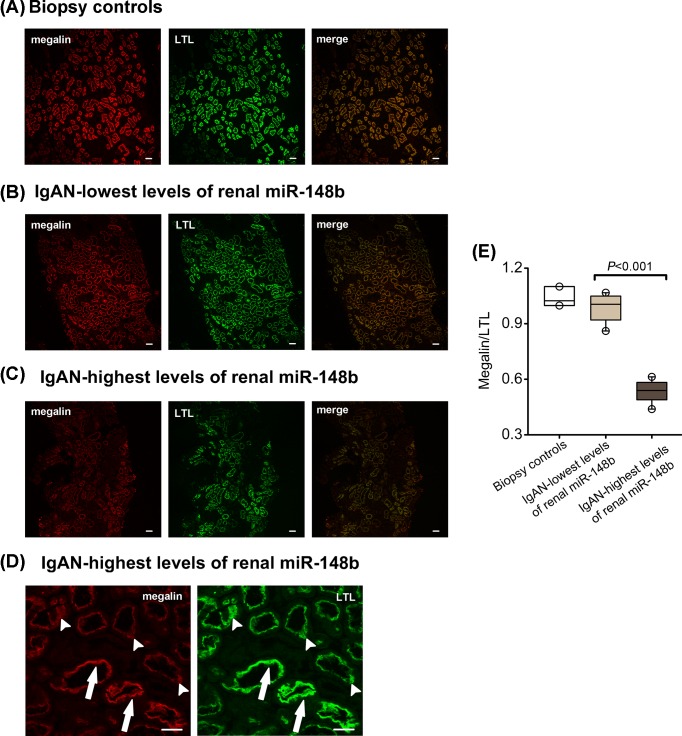
Figure 3. Renal megalin protein expression by immunofluorescence in biopsy controls and in IgAN patients with the highest or the lowest expression of renal miR-148b.
The images show double staining for megalin (red) and LTL (green) in kidney tissue from biopsy controls (A), IgAN patients with the lowest levels of renal miR-148b (B) or patients with the highest levels (C). Scale bars = 40 μm. (D) Higher magnification images from a patient belonging to the group with the highest levels of renal miR-148b. Some tubular profiles show intense labeling for both LTL and megalin (arrows), while others, that also show significant labeling for LTL, reveal much weaker labeling for megalin (arrowheads). Scale bars = 40 μm. (E) Quantitative analysis of megalin protein expression showing the ratios of megalin staining intensity to that of LTL in each section (n=3 for biopsy controls and n=10 for each of the two IgAN groups). Each box plot represents median, 25th and 75th percentiles. Whiskers represent 1.5-times interquartile range.

