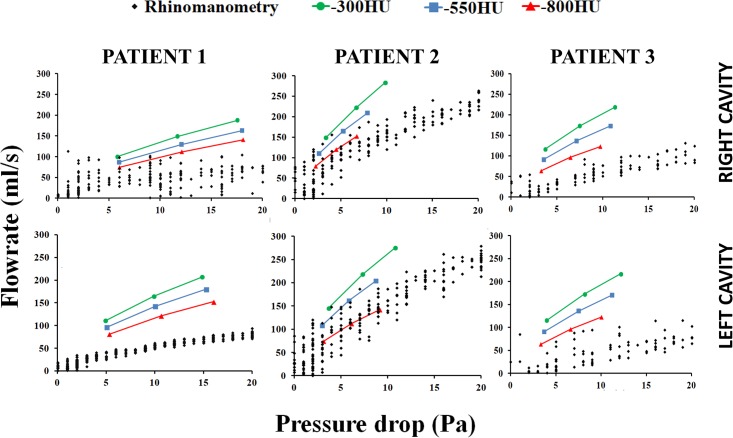
Fig 5. Flow-pressure curve measured with rhinomanometry and calculated with CFD in 3D models reconstructed with segmentation thresholds of -300HU, -550HU, and -800HU.
Note the systematic increase in nasal airflow (reduction in nasal resistance) as the segmentation threshold increases from -800HU to -300HU.

