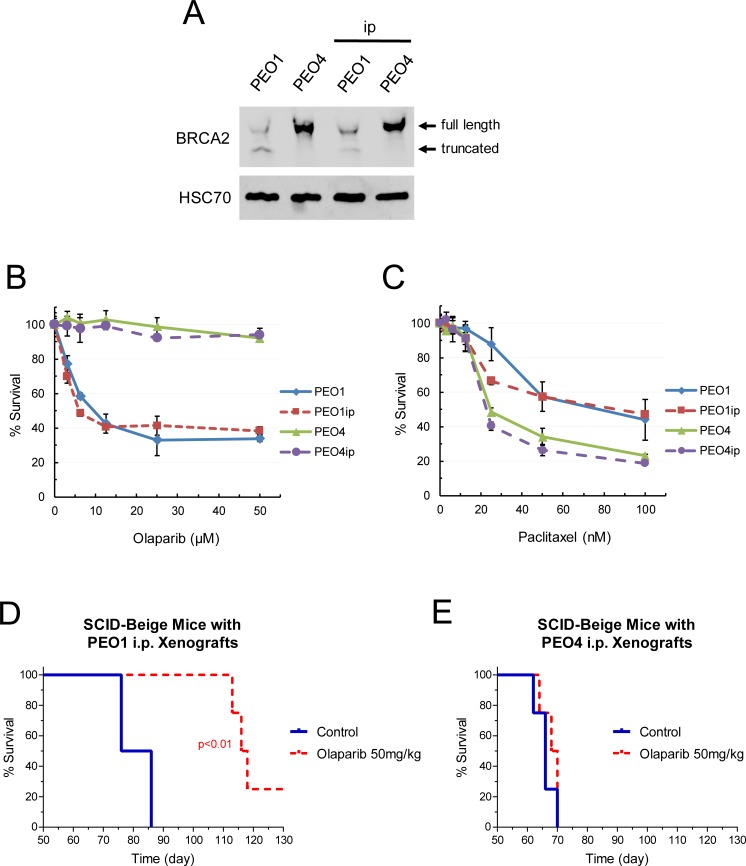
Fig 3. Characterization of intraperitoneal EOC cell lines and xenografts.
(A) Expression of BRCA2 in PEO1/4 cells and PEO1/4ip cells. Total protein was isolated from cells and subjected to western blot analysis for BRCA2 protein. HSC70 protein was used as a loading control. BRCA2 wild type and mutant bands are shown. (B, C) Sensitivity of PEO1/4 cells and PEO1/4ip cells to olaparib and paclitaxel. Cells were treated with various concentrations of olaparib or paclitaxel for 72 hr. MTS cytotoxicity assay was performed to determine percent survival relative to vehicle-treated controls. Data are means ± SE. (D, E) SCID-Beige mice were inoculated i.p. with PEO1ip or PEO4ip cells. After 3 days, mice were randomly assigned to 2 groups (n = 4) and treated i.p. with vehicle and olaparib (50 mg/kg) daily for 6 weeks (day 3 to 45). The body condition score (BCS) of mice bearing PEO1ip xenografts was monitored and the abdominal circumference of mice bearing PEO4ip xenografts was measured every 2–3 days to determine the endpoint and the Kaplan-Meier survival curve. p values were determined by the Mantel-Cox test compared with the control.

