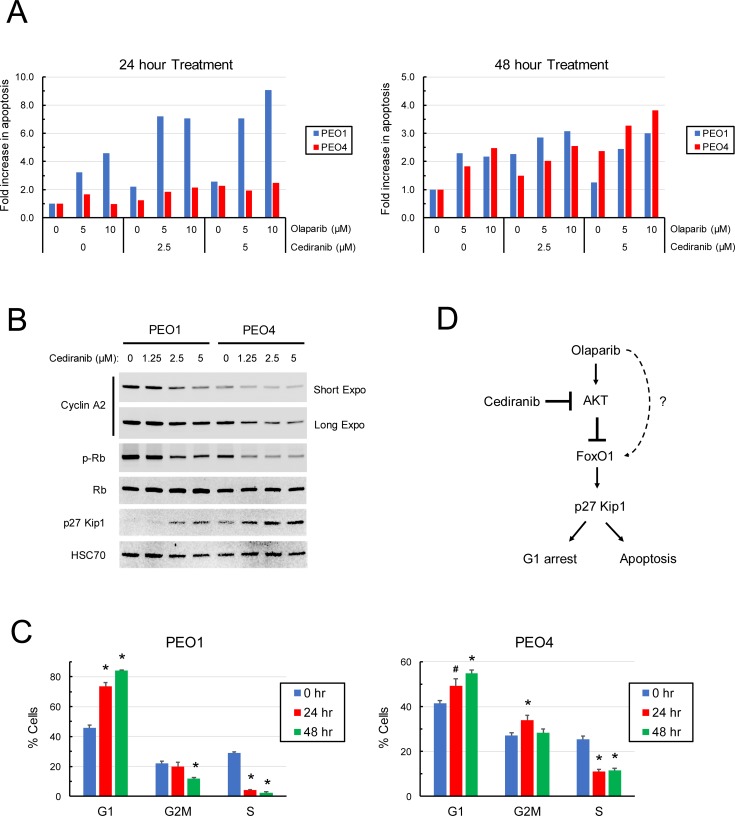
Fig 7. Effects of cediranib on olaparib-induced apoptosis and cell cycle progression in EOC cells.
(A) PEO1 and PEO4 cells were pre-treated with 0, 2.5, and 5 μM cediranib for 1 hr and then treated with 0, 5, and 10 μM olaparib in the continuous presence of cediranib. After 24 and 48 hr of incubation, cells were lysed, and native protein was obtained to determine caspase 3/7 activity. The protein concentration of lysates was also determined to normalize the caspase 3/7 activity in each sample. The level of apoptosis is expressed as the fold change in the normalized caspase 3/7 activity with respect to the vehicle-treated control in each cell line. (B) PEO1 and PEO4 cells were treated with 0, 2.5, and 5 μM cediranib for 24 hr. Western blot analysis was performed to determine the protein levels of phospho-Rb (Ser780), cyclin A, p27 Kip1, and HSC70. (C) PEO1 and PEO4 cells were treated with 5 μM cediranib for 24 and 48 hr. Cells were pulse-treated with 10 μM EdU for 1 hr prior to flow cytometric analysis. G1, S, G2 populations were gated to show the percentage of cells in each phase. Data are means ± SD. *, p < 0.01; #, p < 0.05, compared with the 0 hr controls. (D) The AKT signaling pathway leads to blockade of the FoxO1-p27 Kip1-mediated apoptosis and G1 arrest. Cediranib inhibits olaparib-induced AKT activity, thereby enhancing the efficacy of olaparib (and triapine) against EOC. Olaparib also induces apoptosis possibly through FoxO1-p27 Kip1 and unknown mechanisms that remain to be determined.

