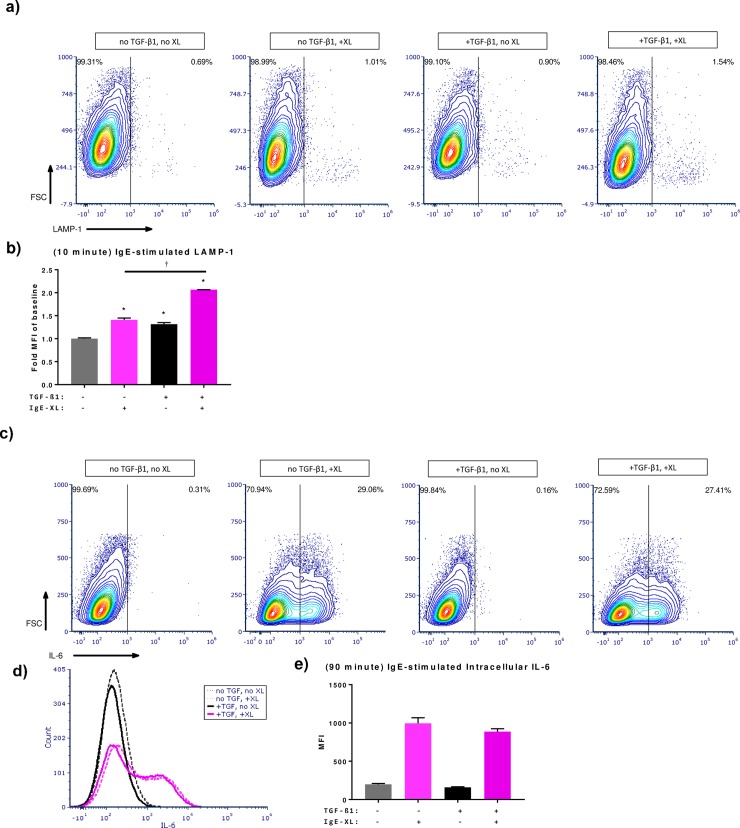
Fig 3. IgE-stimulated LAMP-1 translocation and early phase IL-6 production.
Representative cytograms of (a) surface LAMP-1 expression (10 minute activation) and (c) intracellular IL-6 (90 minute activation) analyzed via flow cytometry. (b) Fold change of mean fluorescence intensity compared to baseline (no TGF-β1, no IgE crosslink) for LAMP-1 expression; * indicates significant difference from baseline, † indicates significant difference compared to TGF-β1-treated, IgE-crosslinked groups. (d) Representative histogram of intracellular IL-6. (e) Mean fluorescence intensity for intracellular IL-6. Significance was noted at p<0.05.

