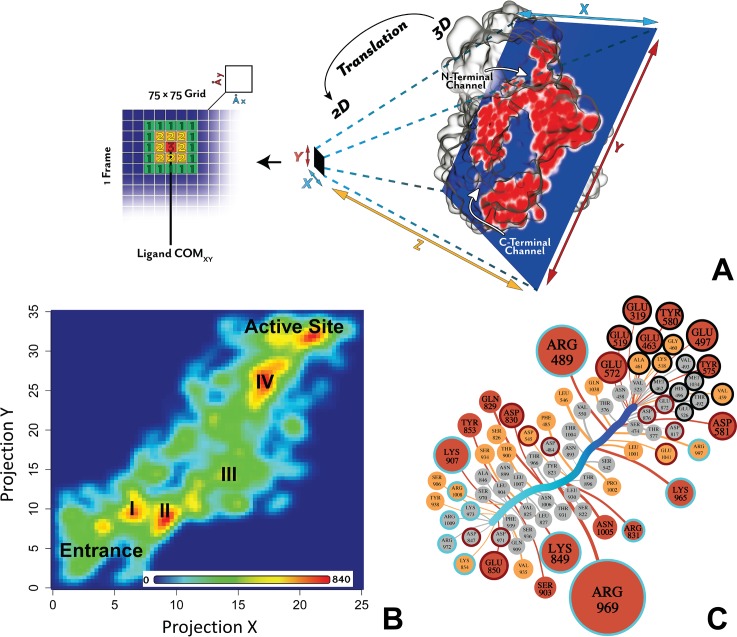
Fig 3. Ligand migration through the C-terminal channel.
A: Definition of 2D projection to create a ligand occupancy map. The plane defined by the cross section through the centre of the C-terminal channel was used to map the 3D coordinates of the centre of mass (COM) of all the ligands into the X and Y projections. The plane is in blue and the protein slice in this plane is in red. The ligand occupancy map was calculated using a 75x75 grid matrix. For each frame of each simulation, a 2D coordinates of the ligand COM is counted and located into one of the grid cell. B: The 2D ligand occupancy map from the all 30-ns sMD trajectories for each ligand. The entrance of the C-terminal channel and the active site are labelled. The transient stable states corresponding to interactions with Glu850 and Lys907 (I); Lys849 and Asp830 (II); Arg969 and water reservoir (III) and Arg489 and Lys965 (IV). Red indicates high occupancy and blue low occupancy. Colouring is linear and values in the bar in counts. C: The ligand-residue binding network (LRBN) derived from the ligand-residue interaction energy of the all sMD trajectories. Nodes are residues interacting with the ligand during the migration. The size and colour of the nodes correspond to the strength of interaction. The 25% and 50% strongest interactions and the remaining frequently occurring interactions are in red, yellow and grey, respectively. Edges reflect the period of occurrence of a ligand-residue interaction; thicker edges show prolong interactions. The average ligand path is shown as a thick light-to-dark-blue-changing colour line. The active site, positively-charged and negatively-charged residues are circled in black, blue and red, respectively.

