
Fig. 2.
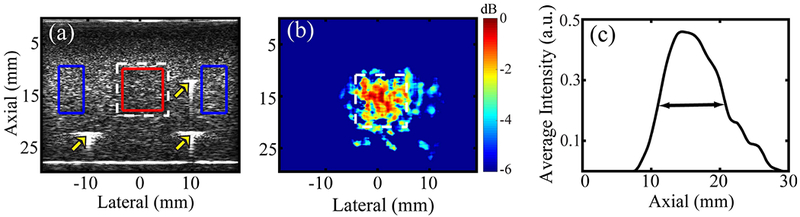
(a) B-mode ultrasound image of phantom #1 with the inclusion boundary marked with a white dashed line. The red and blue contours represent regions of interest (ROIs) in the inclusion and the background, respectively. Three bright points (marked by arrows) in the B-mode indicate locations of fiducial markers. (b) BSS-FPL derived parametric MMUS image of phantom #1 using axial kernel length = λ and ensemble length = 5.5 s. The color bar indicates the normalized MMUS image intensity in dB, with normalization relative to the maximum value. (c) Laterally-averaged pixel intensity as a function of axial distance. The Full-width-at-half-max (double arrow) of the curve was used to estimate the inclusion height. True height of the inclusion is 10 mm.