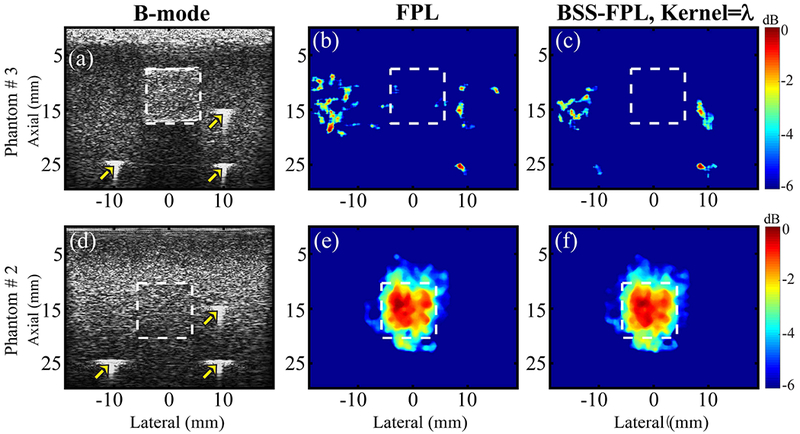
Fig. 3.

For phantoms #3 (with sham stiff inclusion, top row) and #2 (with SPIO-laden stiff inclusion, bottom row), B-mode ultrasound (a, d) and parametric MMUS images derived using FPL (b, e) and BSS-FPL with kernel length = λ (c, f). White dashed lines delineate the inclusion boundaries derived using the locations of fiducial markers (marked by arrows). RF data with ensemble length = 7.5 s were used. The color bar indicates MMUS image intensity on a dB scale with normalization relative to the maximum value.
