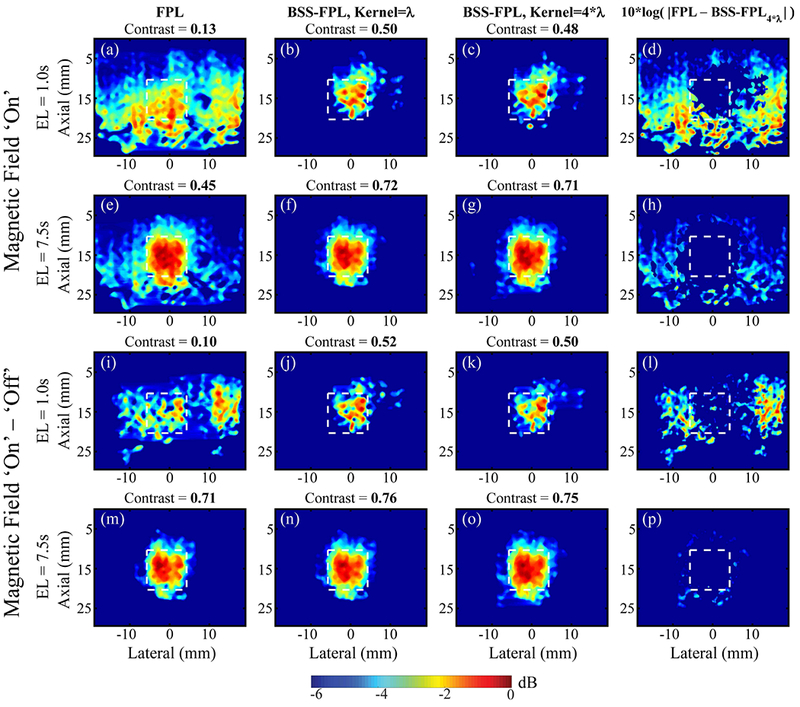
Fig. 5.

FPL and BSS-FPL derived MMUS images of phantom #2 using magnetic field ‘on’ (B-on) and magnetic field ‘on’ – ‘off’ (background subtracted) data. First three columns from left to right show MMUS images derived using FPL, BSS-FPL with kernel length = λ, and 4*λ, respectively and fourth column shows difference between FPL and BSS-FPL with kernel length 4*λ derived images. First and second rows show MMUS images derived using B-on data, whereas third and fourth rows show MMUS images derived using background subtracted data. Ensemble length (EL) of 1.0 s or 7.5 s was used to generate MMUS images. White dashed lines indicate the inclusion boundaries. Measured contrast is listed above each corresponding image.
