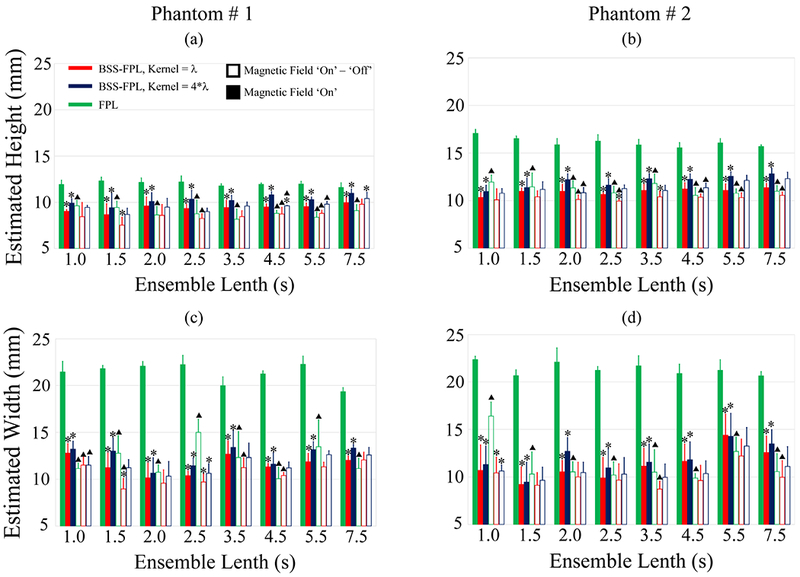
Fig. 7.

Estimated height (top row) and width (bottom row) of inclusions in phantoms #1 (a, c) and #2 (b, d) as a function of ensemble lengths. Data are plotted as median + 0.5 × interquartile range over 5 acquisitions in different elevational planes in each phantom. Green, red, and blue represent FPL, BSS-FPL with kernel length = λ, and BSS-FPL with kernel length = 4*λ, respectively. Filled and open bars represent magnetic field ‘on’ (B-on) and magnetic field ‘on’ – ‘off’ (background subtracted) data. Black dash-dot line represents the true height and width of the inclusion. Asterisks (*) represent statistically different (p ≤ 0.05) values between FPL versus BSS-FPL with kernel length = λ and 4*λ. Triangles (Δ) represent statistically different (p ≤ 0.05) values between B-on versus background subtracted data.
