
Fig. 6. Two-color SRS images acquired on fresh AD mouse brain in the CH region.
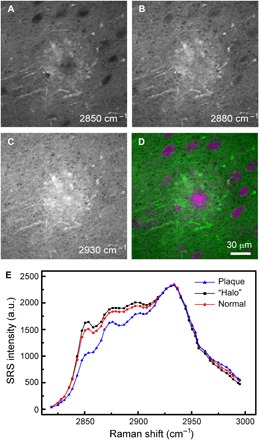
Individual SRS images at (A) 2850 cm−1, (B) 2880 cm−1, and (C) 2930 cm−1 and (D) the composite two-color image showing the distribution of lipids (green) and total protein (magenta). (E) SRS spectra of the plaque, surrounding halo and normal tissue. Image size, 512 by 512 pixels (1 s per frame).