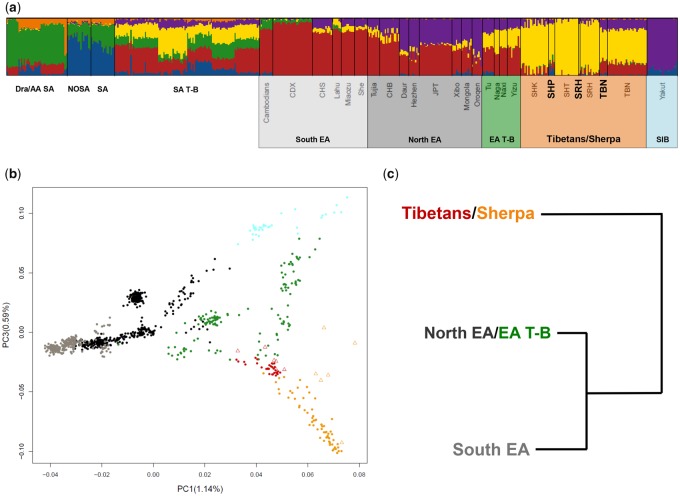
Fig. 1.
—Population structure analyses performed on the “low-density” data set. (A) K = 6 ADMIXTURE analysis was performed on 1,173 individuals (for simplicity a subset of 520 individuals are plotted) belonging to the Asian groups included in the “low-density” data set. South Asian populations are labelled according to the following macrogroups: Dravidian and Austro-Asiatic speakers from South Asia, Dra/AA SA; Northern South Asians, NOSA; Southern South Asians, SA; South Asian Tibeto-Burmans, SA T-B. East Asian populations are reported according to their respective population label. High-altitude Tibetan/Sherpa samples sequenced for the whole genome are highlighted in bold. (B) PC1 versus PC3 performed on the East Asian and Tibeto-Burman populations included in the “low-density” data set. Samples typed with SNP-chip arrays are reported as full dots, while Tibetan/Sherpa samples sequenced for the whole genome are labelled as empty triangles. (C) fineSTRUCTRE hierarchical clustering analysis performed on a subset of East Asian populations included in the “low-density” data set. Only the upper splitting branches are reported. Shaded boxes under (A), color of points in (B), and cluster labels in (C) are color-coded according to the following macrogroups: South East Asians, light-gray; North East Asians, dark-gray/black, Siberians, light blue; Tibeto-Burmans (T-B), green; Tibetans, red; Sherpa, orange.

