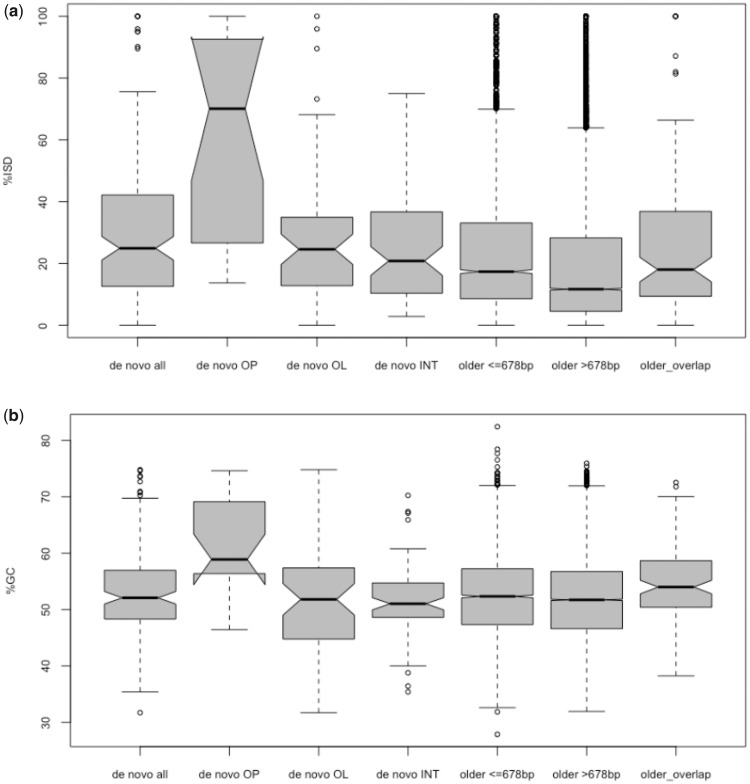
Fig. 3.
—Comparison of intrinsic structural disorder percentage (a) and GC content (b) between de novo genes and older genes. Gray boxes shows values between first and third quartile. Medians are shown as black lines. Whiskers: minimum and maximum values excluding outliers. OP, overprinting; OL, overlapping with noncoding regions of older genes; INT, intergenic.

