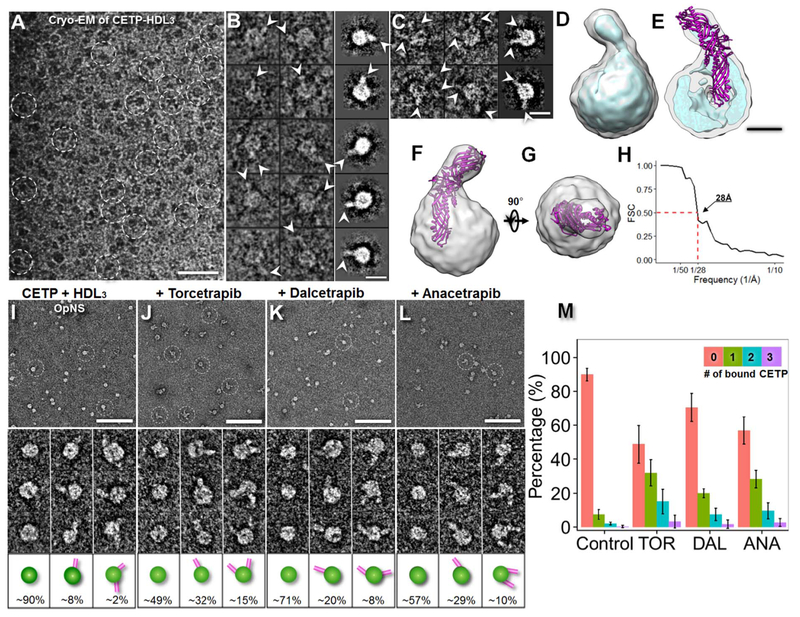
Fig. 2.
Effects of inhibitors on CETP bound to HDL, as determined by cryo-EM and OpNS EM. A) Cryo-EM survey view of the complexes of CETP bound with human plasma HDL3 embedded in vitreous ice (dashed circles). B) Representative cryo-EM images (contrast inverted, left column) and reference-free class averages (shown in the right column) of the complexes of one HDL3 bound to one CETP molecule and C) one HDL3 bound to two CETP molecules. D) Cryo-EM 3D density map of the CETP-HDL complex reconstructed by a single-particle 3D reconstruction method from a relatively homogenous population of particles (3200 complexes, approximately 13% of total particles) displayed in two contour levels (the gray contour level corresponds to the molecular volume of the complex, whereas the cyan contour level corresponds to approximately 37% of the molecular volume). E) Cutaway surface view showing that the spherical HDL has a diameter of approximately 97 Å with an approximately 20 Å thick high-density shell and an approximately 50 Å diameter inner low-density core. F) and G) Two perpendicular views of the CETP-HDL cryo-EM reconstruction showing the crystal structure of the docked CETP within the envelope of the EM density map. An approximately 55 Å-long portion of the CETP N-terminal penetrated or merged with the HDL surface. H) The FSC curve showing that the resolution of the cryo-EM single-particle 3D reconstruction is approximately 28 Å according to the 0.5 Fourier shell correlation criterion. I) OpNS EM survey images (top panel), representative particle images (middle panel) and the corresponding particle cartoons with their populations (bottom panel) of the samples of HDL3 incubated with CETP. The CETP-HDL complexes are indicated by white dashed circles. The sample was also repeated under co-incubation with J) Torcetrapib, K) Dalcetrapib or L) Anacetrapib. The percentages of HDL particles involved in binding with no CETP, binding with one CETP and binding with two CETPs are shown at the bottom of the corresponding cartoons. The percentage of HDL particles binding more than two CETPs is not shown. The percentage of HDL was calculated by dividing the total number of HDL + CETP binary complexes by the total number of HDL particles (including the particles forming into binary complexes). M) Histogram of the percentage of CETP-bound HDL over the entire HDL population. p-values of 2.20 × 10⁻¹⁶, 1.79 × 10⁻⁷ and 1.95 × 10⁻¹⁴ were obtained for Torcetrapib, Dalcetrapib and Anacetrapib, respectively, via Pearson’s chi-square test. Particle window size: I–L, 30 nm. Scale bars: A, 50 nm; B and C, 10 nm; E, 4 nm; I–L, 100 nm.

