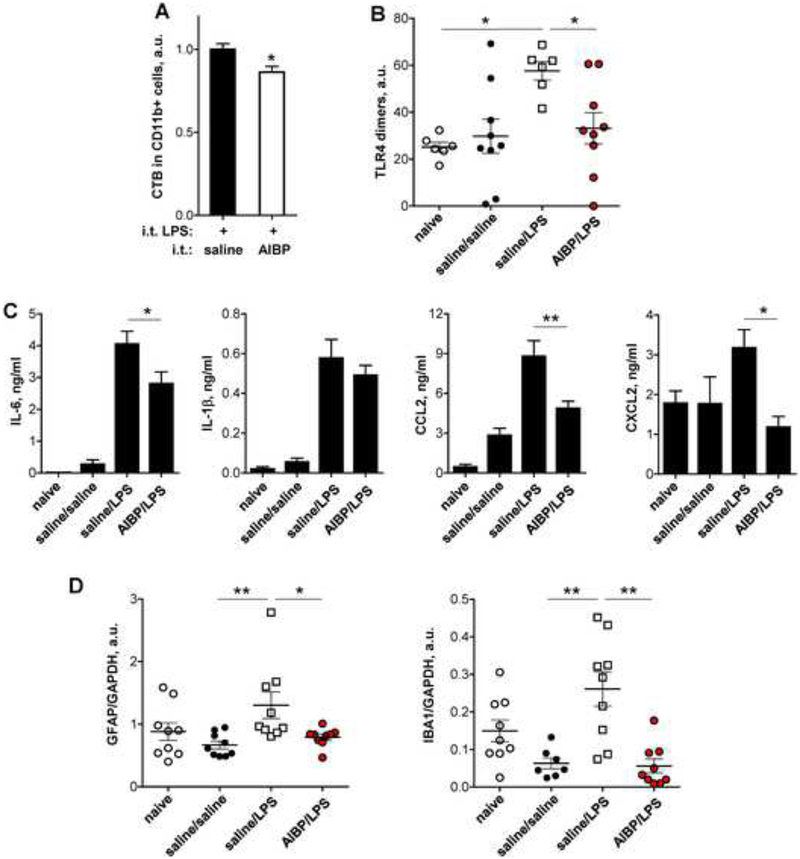
Figure 4. Intrathecal AIBP reduces lipid rafts and TLR4 dimerization in spinal myeloid cells, neuroinflammation, and glial activation.
A-B, Male mice were given an i.t. injection of AIBP (0.5 μg/ 5 μl) or saline (5 μl); two hours later, all mice were given an i.t. injection of LPS (0.1 μg/ 5 μl) and were terminated 15 min later. A, Spinal cords were isolated, demyelinated, stained for CD11b and cholera toxin B (CTB) and subjected to a flow cytometry analysis. Mean±SEM; n=11; *, p<0.05 (Student’s t-test). B, Demyelinated spinal homogenates were stained with MTS510, SA15–21 and isotype control antibodies, analyzed by flow cytometry, and levels of TLR4 dimers were calculated as described in Methods. Mean±SEM; n=6–9; *, p<0.05 (Newman-Keuls multiple comparison test). C-D, Male mice were given an i.t. injection of AIBP (0.5 μg/ 5 μl) or saline (5 μl); two hours later, all mice were given an i.t. injection of LPS (0.1 μg/ 5 μl) and were terminated 4 hours later. Naïve mice were used as a negative control. C, CSF was isolated and tested in ELISA for the levels of inflammatory cytokines. Mean±SEM; n=8–11; *, p<0.05; **, p<0.01 (one-way ANOVA with Bonferroni’s multiple comparison test). Levels of TNFα in these samples were below detection limit. D, Lumbar spinal cord was isolated and analyzed in western blot for expression of GFAP and IBA1 (see Fig. S5). Mean±SEM; n=7–9; *, p<0.05; **, p<0.01 (non-parametric Kruskal-Wallis test with Dunn’s multiple comparison test). See also Figures S4B and S5.

