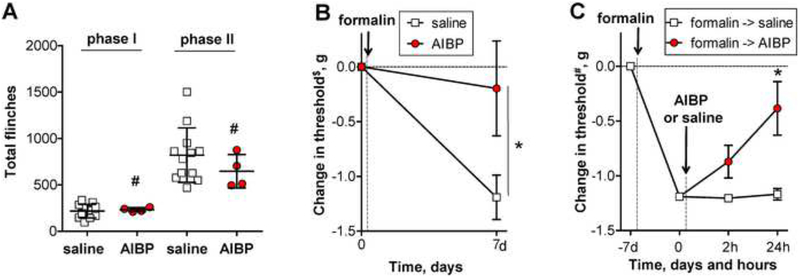
Figure 6. Intrathecal AIBP prevents and reverses i.t. LPS- and intraplantar formalin-induced allodynia.
A-B, Following baseline von Frey threshold testing, male mice were given an intraplantar injection of formalin in one hind paw. A, The graph shows total numbers of hind paw flinches in phase I (1–9 min) and phase II (10–50 min). Mean±SD; n=4–12 per group; #, non-significant, p>0.05 (Student’s t-test). B, The graph shows $baseline-normalized changes in the withdrawal threshold in the ipsilateral paw. Mean±SEM; n=4–12 per group; *, p<0.05 (Student’s t-test for the 7 day time point only). C, In a group of animals different from those used in panels A and B, von Frey readings were #normalized at the 7th day post-formalin and the mice received i.t. AIBP (0.5 μg/ 5 μl) or saline (5 μl). Mean±SEM; n=4 per group; *, p<0.05 between 0 and 24 hours (repeated measures one-way ANOVA with Bonferroni post-test).

