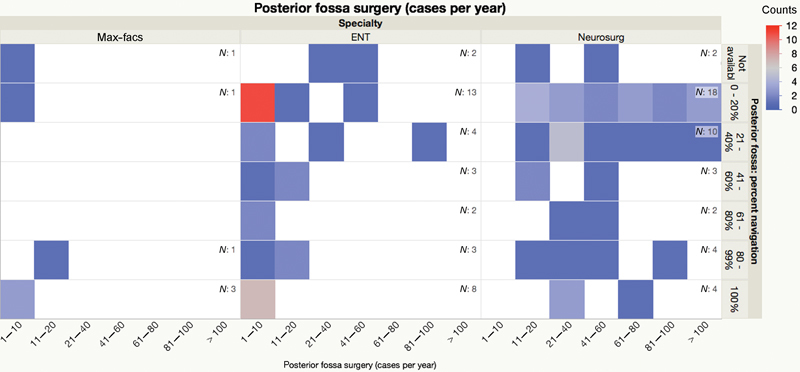
Fig. 6.

Heat map of estimated case load per year per department at the posterior fossa (x-axis: ranges in absolute number), split by specialty and estimated percent of cases treated with navigation guidance (y-axis). Counts per field are color-coded.
