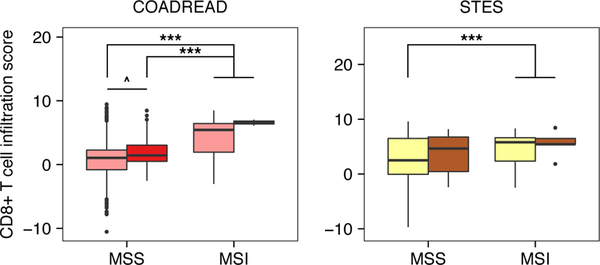
Figure 2: CD8+ T cell infiltration after adjusting for microsatellite instability and virus infection status.
Boxplots depicting the distribution of CD8+ T cell infiltration scores across COADREAD and STES samples stratified by MSI status and virus infection status. Dark colors indicate virus-infected samples and light colors indicate non-infected samples. Each box spans quartiles with the lines representing the median CD8+ T cell infiltration score for each group. Whiskers represent absolute range excluding outliers. All outliers were included in the plot. P-values were calculated using the Wilcoxon sum-rank test. Significant associations are marked (^ P ≤ 0.10, *** P < 0.01).

