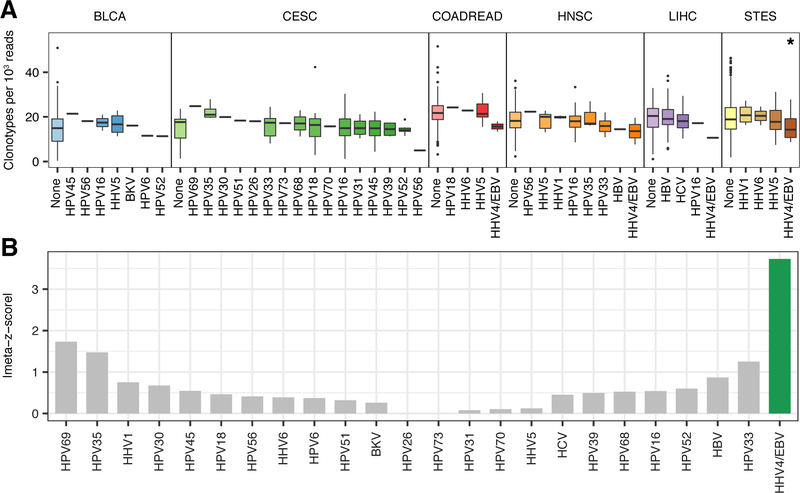
Figure 3: T cell receptor repertoire diversity between samples infected with different viruses.
A, Boxplots depicting the distribution of unique CDR3 calls (clonotypes) per 1,000 TCR reads in samples from six tumor types infected with different viruses. Each box spans quartiles with the lines representing the median clonal diversity for each group. Whiskers represent absolute range excluding outliers. All outliers were included in the plot. P-values were calculated using the Wilcoxon sum-rank test. B, Meta-z-score absolute values indicating associations between infection of a given virus and reduced TCR clonal diversity across 6 tumor types. Viruses were ranked by unweighted meta-z-score. Green bars indicate an unweighted meta-z-score < −1.96 (significantly lower TCR clonal diversity, two-tailed p-value < 0.05) while grey bars indicate an unweighted meta-z-score whose absolute value is < 1.96.

