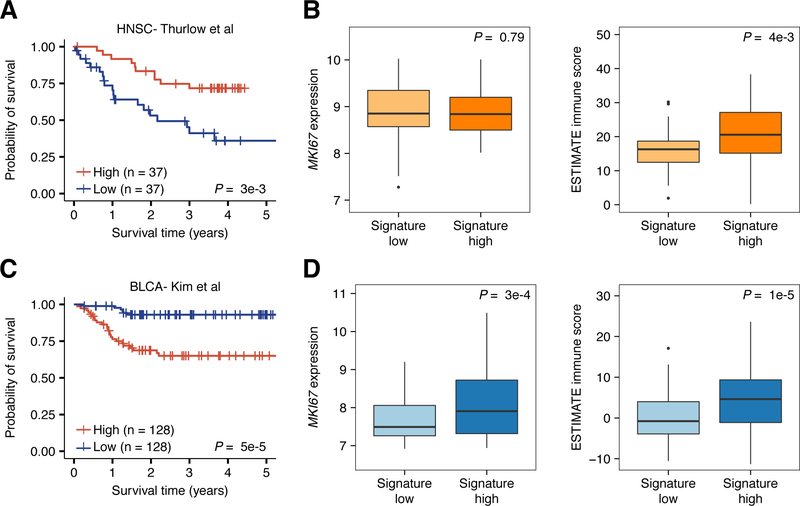
Figure 5: Association between the virus infection gene expression signature and survival of head and neck cancer and bladder patients.
A, Kaplan-Meier plot depicting the survival probability over five years for samples with high (red) and low (blue) virus infection signature scores in the Thurlow et al head and neck cancer dataset. B, Boxplots depicting the difference in MKI67 expression (left) and ESTIMATE immune score (right) between signature low and signature high samples in the Thurlow et al dataset. C, Kaplan-Meier plot depicting the survival probability over five years for samples with high (red) and low (blue) virus infection signature scores in the Kim et al bladder cancer dataset. D, Boxplots depicting the difference in MKI67 expression (left) and ESTIMATE immune score (right) between signature low and signature high samples in the Kim et al dataset. For all Kaplan-Meier plots, samples were stratified into high and low groups using the median virus infection score. P-values were calculated using the log-rank test and indicate difference between the survival distributions of the full dataset. Vertical hash marks indicate censored data. In all boxplots, boxes span quartiles with the lines representing the median expression or score for each group. Whiskers represent absolute range excluding outliers. All outliers were included in the plot. P-values were calculated using the Wilcoxon sum-rank test.

