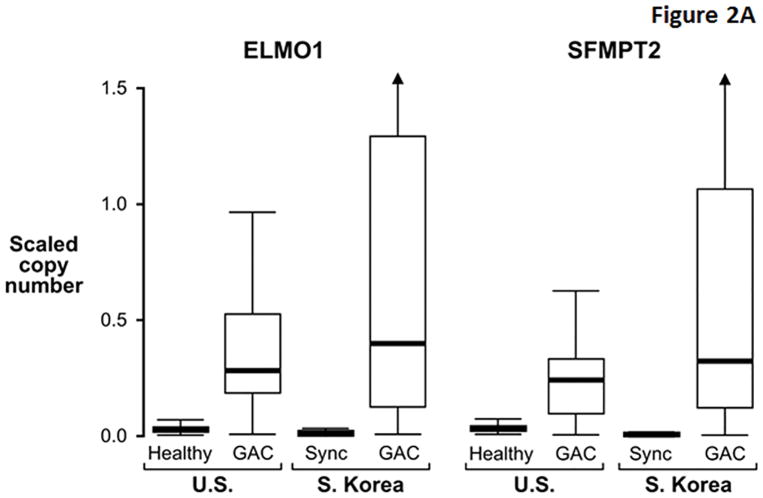
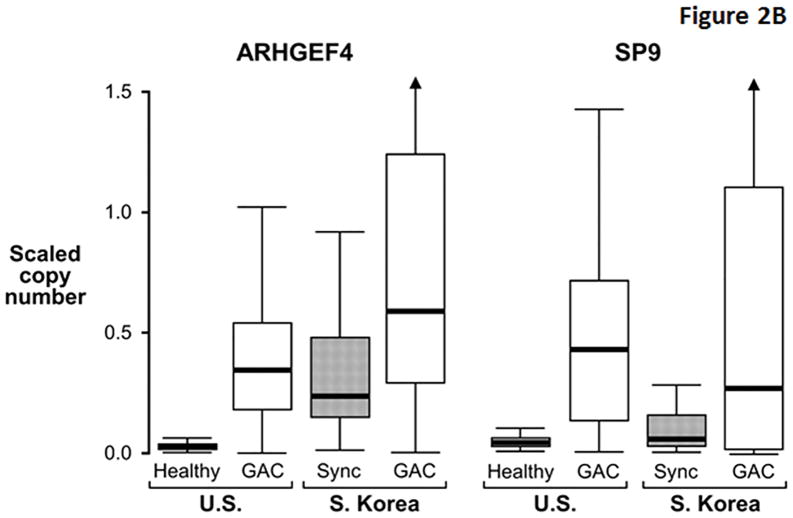
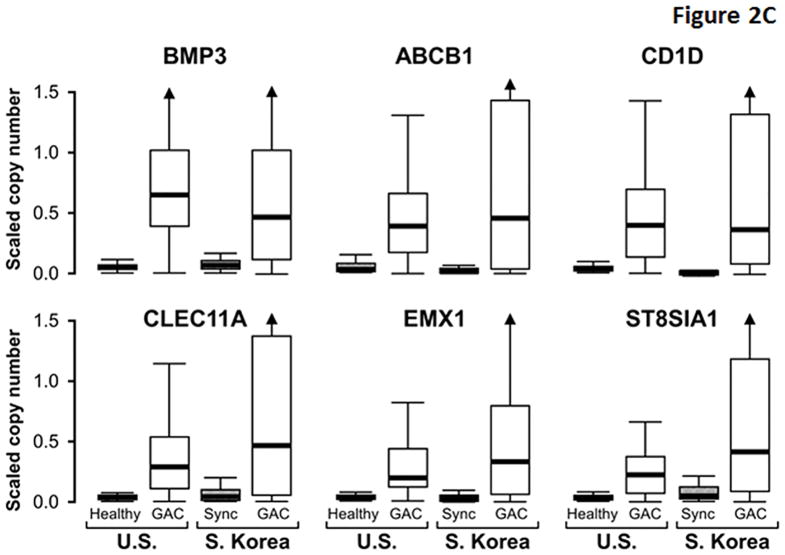
Figure 2. Distributions of selected methylated DNA markers in gastric adenocarcinoma (GAC) and gastric control tissues from U.S. and S. Korean cohorts.
(A) Two markers showing similarly high discrimination for GAC in geographic cohorts. Control tissues comprised histologically normal biopsies from healthy patients (Healthy) in the U.S. cohort and from mucosa synchronous (Sync) to GAC in the S. Korean cohort. (B) Two markers with relatively high control levels in the S. Korean samples. (C) Distributions of remaining six top markers. (Marker levels in each cohort were β-actin standardized and scaled according to their respective standard deviation. This allows data plots on the same vertical scale across cohorts and preserves the relative differences between cases and controls.)


