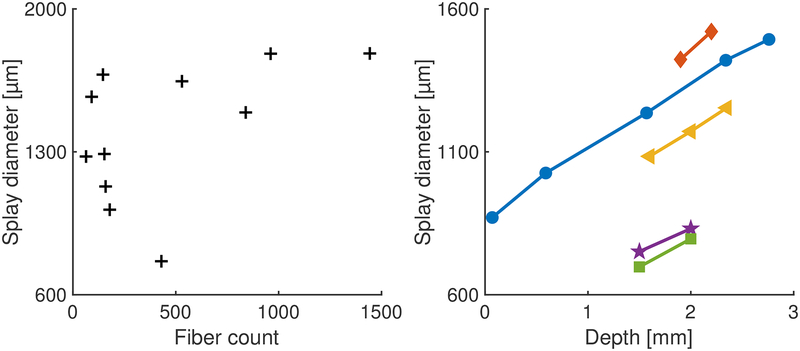
Figure 3. Diameter of splaying increases linearly with depth.
Left: Splay of fibers at a depth of 2.9 mm, in the target region of songbird basal ganglia from 11 animals. The plot shows the diameter of the ellipse describing the splay of the fibers for various implant sizes. As the number of fibers increases, the area accessed by the fibers increases. Right: For five animals, slices were collected at multiple depths to estimate splay diameter as a function of depth. For each 1 mm of implant depth, the diameter of the splay increases by 229.1 ± 51.1 μm (std. dev.). Each color/marker pair corresponds with a distinct animal.

