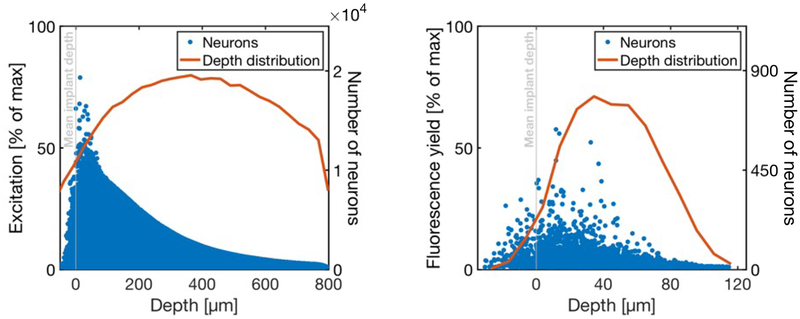
Figure 8. A computational model indicates that optical microfibers would record or stimulate neurons immediately below the fiber tips.
Left: Distribution of light intensities reaching all modeled neurons, for uniform illumination of all fibers in the fiber bundle. These values are normalized by the maximum possible optical power (i.e., the power at the point in the tissue with the highest intensity). Blue dots are individual neurons, and the red line is a depth distribution of neurons that receive >1% of max excitation, indicating that for full bundle illumination, optical stimulation would activate cells far away from the fiber tips. Right: The round-trip fluorescence yield is calculated by first taking the total excitation power reaching the neuron (left) and scaling that by the strongest overlapping fiber profile (representing the collected fluorescence emission). These values are normalized by the maximum possible round-trip fluorescence yield (the maximum achievable given the excitation profile). Blue dots are individual neurons, and the red line is a depth distribution of neurons with >1% of max excitation.

