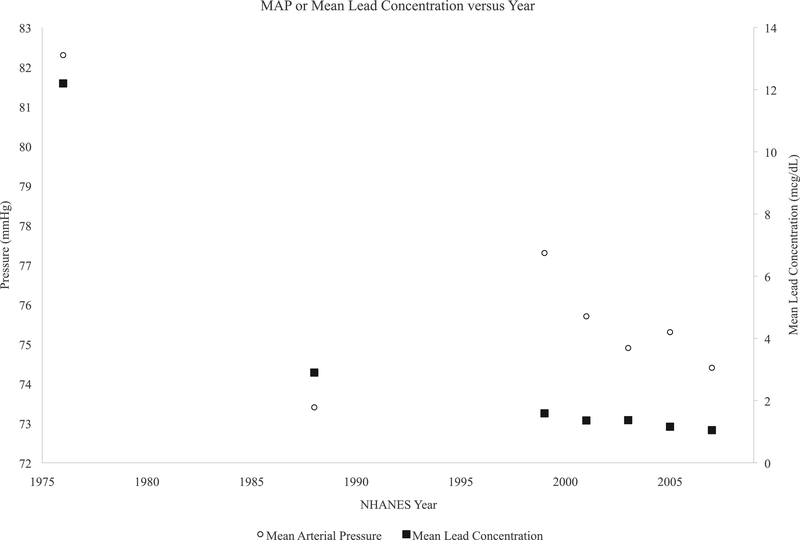
Figure 1:
Temporal trends in MAP (open circle), and population mean lead concentration (closed squares) in children. Left y-axis is pressure in millimeters mercury(mmHg) while right y-axis is the population mean blood lead concentration in micrograms per deciliter(mcg/dL). Values are plotted against the midpoint of each NHANES along the X axis.

