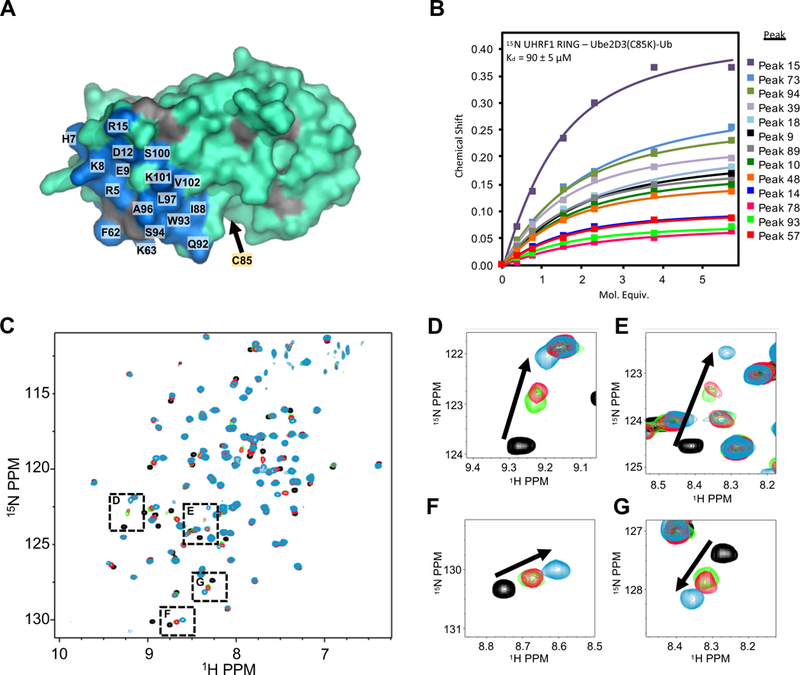
Figure 4 |. The UHRF1-UBL does not enhance E2~Ub binding to the RING.

(A) UHRF1-RING binding site (blue on cyan) on the E2 Ube2D3 as determined by 1H15N-HSQC experiments containing 200 μM 15N-Ube2D3(C85S/S22R) and 50 μM UHRF1-RING domain (see methods and Supplemental Figure 4A). Gray; prolines.
(B) Binding curves generated from NMR peak chemical shifts of 82 μM 15N-UHRF1-RING as a function of increasing Ube2D3(C85K/S22R)-Ub. The UHRF1-RING spectrum is not assigned.
(C) 1H15N-HSQC of 100 μM 15N UHRF1-RING in the absence (black) or presence (green) of 100 μM Ube2D3(C85K)-Ub (E2-N-Ub; isopeptide linked E2-Ub) or (red) in the presence of 100 μM E2-N-Ub and 175 μM UHRF1-UBL. The blue spectrum is of 100 μM 15N-UHRF1-RING in the presence of 700 μM S22R-E2-N-Ub (near saturation).
(D-G) Close-up views of peaks indicated in panel C.
