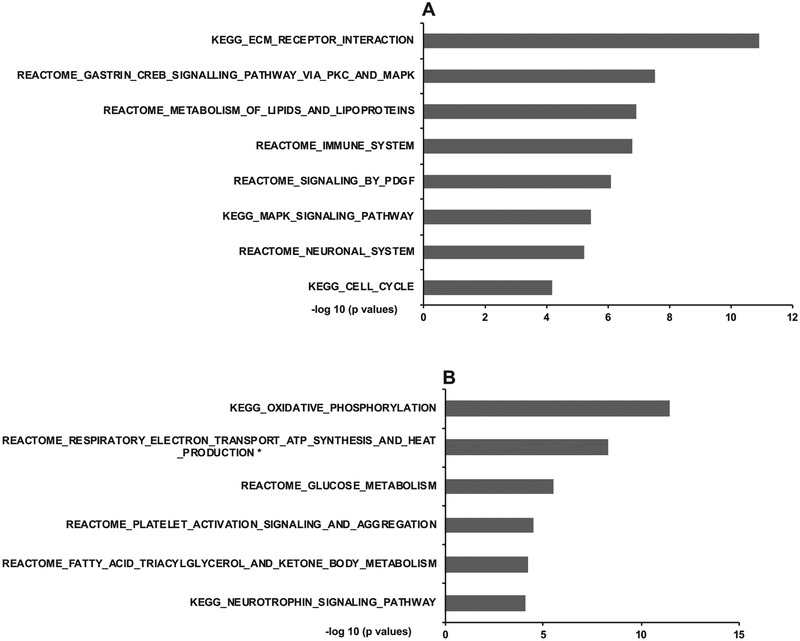
Fig. 4.
Changes in biological pathways in the hippocampus and hypothalamus of Bgn0/− mice based on transcriptome analysis. Top select significant pathways are shown for hippocampus (A) and hypothalamus (B). The −log10 (p.adj < 0.05.) of the significant pathways are show on the x-axis. Full lists of significant pathways are in Supplementary Table 3, Table 4.

