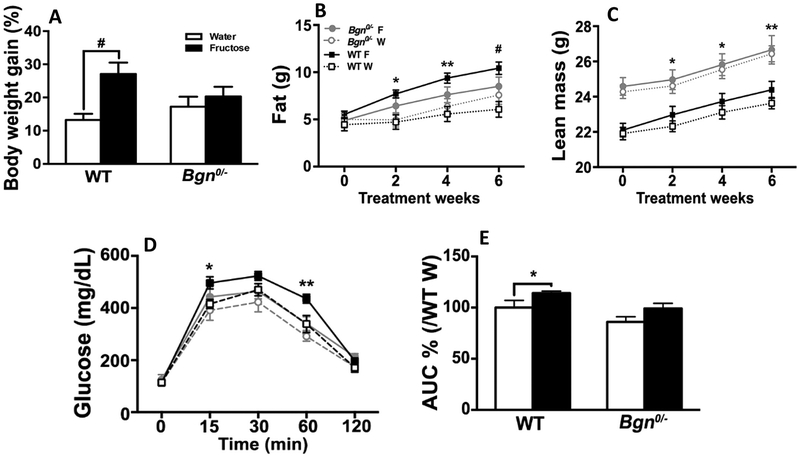
Fig. 5.
Effects of fructose on body composition and intraperitoneal glucose tolerance test. (A) Gain of body weight of WT mice fed on fructose (F) were more significant as compared to WT mice fed on water (W) (p < 0.001), whereas Bgn0/− mice did not show much differences. (B) Fructose preferably increased fat mass in WT but not Bgn0/− mice. (C) Bgn0/− animals had more lean mass than WT controls throughout the study. WT mice fed on fructose slightly increased lean mass as compared to WT mice fed on water, while Bgn0/− mice did not show changes in lean mass between fructose and water treatment. (D) Intraperitoneal glucose tolerance test indicated WT animals in the fructose group had significantly elevated blood glucose compared with either Bgn0/− or WT animals that were fed on water at 15 and 60 min. Bgn0/− animals showed no difference in blood glucose between water and fructose treatment. (E) According to the analysis of the area under the curve (AUC), WT animals fed on fructose had a larger AUC, indicating reduced capacity of glucose clearance compared with either WT or Bgn0/− animals fed on water, and Bgn0/− animals on fructose had similar glucose clearance to the animals in the water groups. Results are presented as mean ± SEM (WT Water vs WT Fructose; *p < 0.05, **p < 0.01, #p < 0.001, n = 6–14).

