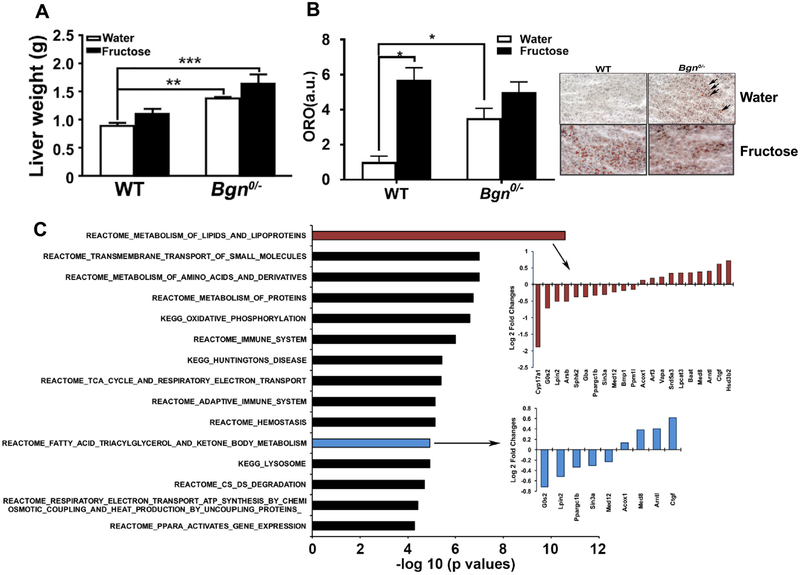
Fig. 6.
Effects of Bgn0/− on liver and peripheral metabolism. (A) The liver of Bgn0/− mice was heavier than that of WT mice and fructose consumption did not further increase liver weight in Bgn0/− mice. However, the liver weight in Bgn0/− mice treated with fructose was significantly higher than that in water treated WT mice. Neutral lipids assessed by Oil Red O (ORO) staining showed a limited number of small lipid droplets in the WT livers whereas much more lipid droplets were visually prominent in the Bgn0/− livers (B). ORO staining intensities quantified using imaging software showed statistically significant increase in Bgn0/− livers (B). Results are presented as mean ± SEM (*p < 0.05; **p < 0.01, n = 4–6). (C) Top select significant pathways affected by Bgn knockdown in Bgn0/− livers based on transcriptome analysis. The −log10 (p.adj < 0.05) of the significant pathways are show on the x-axis. Full lists of significant pathways are in Supplementary Table 6.

