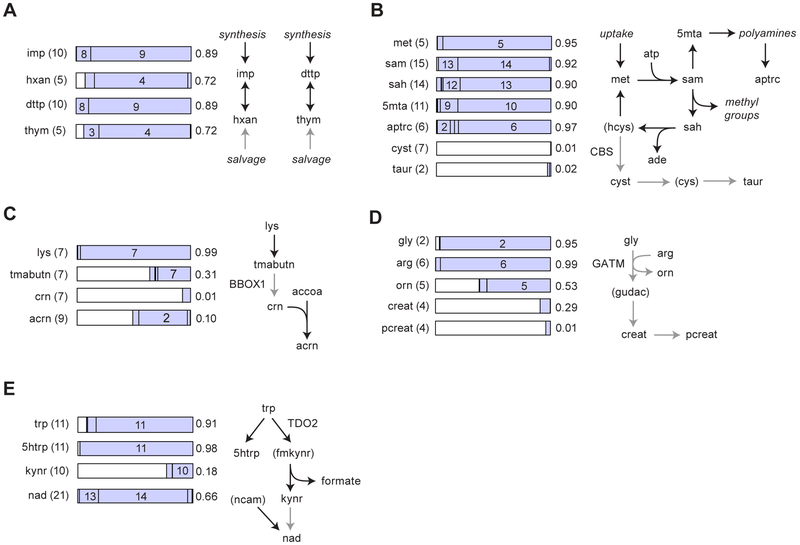
Figure 2. Profiling active and inactive metabolic pathways.
(A-E) MIDs for selected metabolites with carbon number in parentheses (left) are shown as stacked bar charts (middle) with numbers indicating mass isotopomers, together with simplified schemas of the corresponding pathways (right). White regions of bars charts denote the 13C0 MI. Gray arrows denote inactive pathways. Numbers at the right side of the bars indicate 13C enrichment. Metabolites in parentheses were not measureable. Nonstandard abbreviation are hxan, hypoxanthine; thym, thymine; 5mta, 5-methiothioadenosine; aptrc, acetyl-putrescine; cyst, cystathionine; taur, taurine; tmabutn, trimethylammoniobutanoate; crn, carnitine; acrn, acetylcarnitine; orn, ornithine; creat, creatine; pcreat, phosphocreatine, gudac, guanidinoacetate; 5htrp, 5-hydroxytryptophan; kynr, kynurenine; ncam, nicotinamide. For enzymes indicated, see text.

