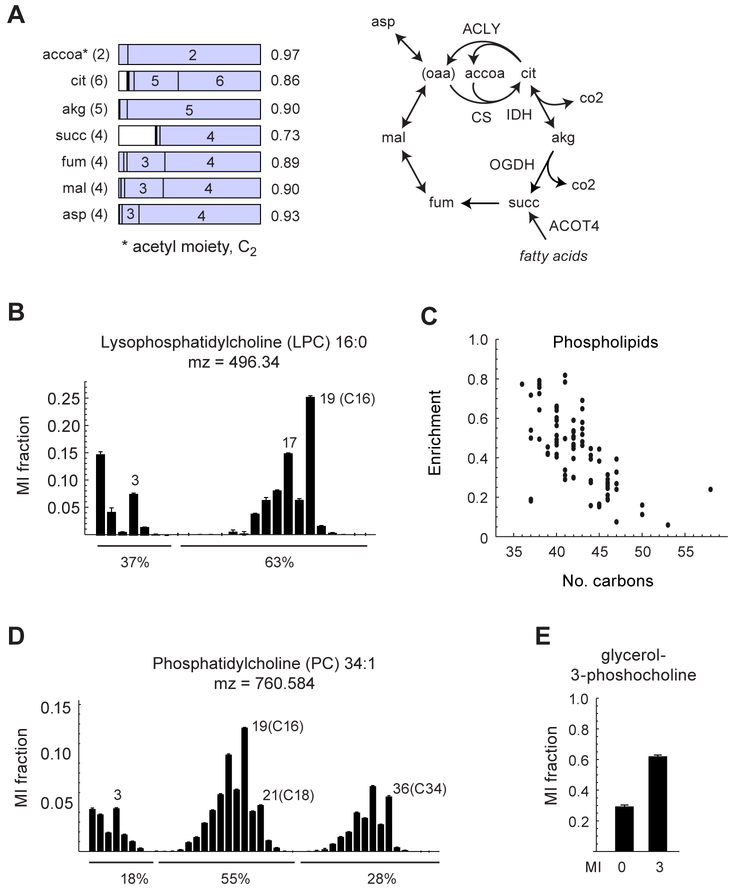
Figure 3. Carbon sources for oxidation and biomass synthesis.
(A) MIDs for TCA cycle metabolites and a simplified schema of the TCA cycle, as in Figure 2. For enzymes indicated, see text. (B) MID for lysophosphatidylcholine 16:0. (C) Plot of 13C enrichment vs. number of carbons for phospholipids, for extracts of HCT116 cells grown in the 13C medium. (D) MID for phosphophatidylcholine 34:1 Notable mass isotopomers are indicated. Percentages denote sums of indicated MI fractions, representing labeled/unlabeled acyl chains (see text). The fraction of heavy chains for PC 34:1 is given by (0.55 + 2 × 0.28) / 2 = 0.55. (E) MID for glycerol-3-phosphocholine. Error bars denote standard deviation. See also Figure S3.

