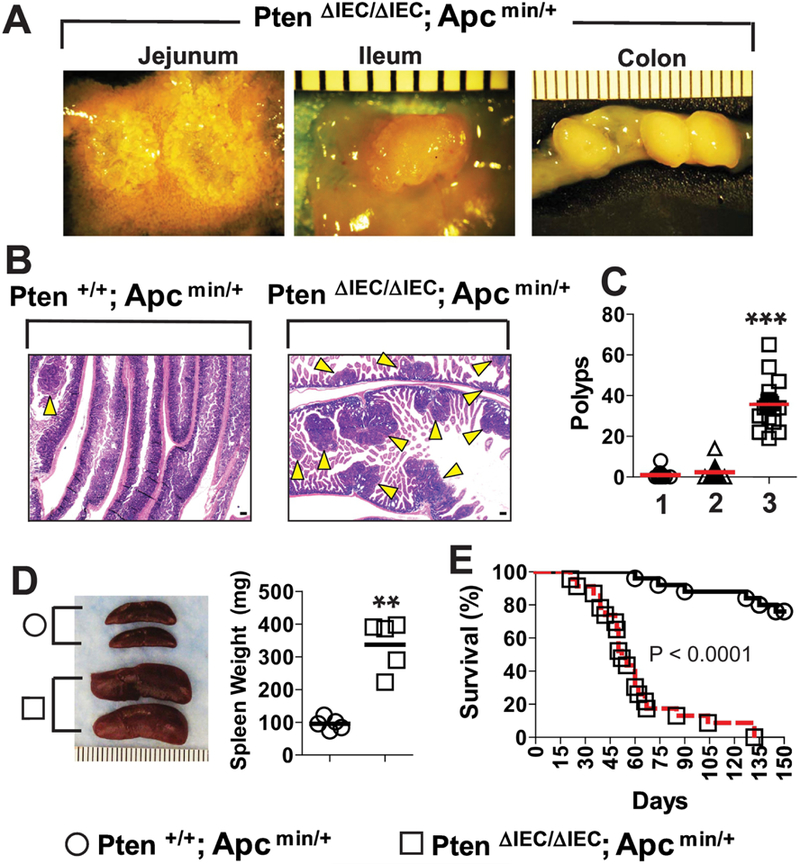
Figure 3: IEC-specific Pten deletion dramatically enhanced the intestinal tumorigenesis in the Apc min/+ background.

(A) Gross images of the tumors observed throughout the small intestine (jejunum and ileum) and the colon of Pten ΔIEC/ΔIEC; Apc min/+ mice. (Scale bar, 1mm). (B) The full length of the small intestine was obtained from Pten ΔIEC/ΔIEC; Apc min/+ and littermate Pten +/+; Apc min/+ mice at the age of 5–6 weeks old, and prepared in a ‘swiss-roll’ method for H&E staining. Arrowhead indicates an individual tumor mass observed under microscope. (scale bar, 100 μm) (C) Using stereoscopic microscopy, the number of visible tumors (≥ 1.0 mm in diameter) was evaluated throughout the small intestine of the age (5–6 weeks old)-matched mice: lane 1, Pten +/+; Apc min/+ (n=12); lane 2, Pten ΔIEC/+; Apc min/+ (n=12); lane 3, Pten ΔIEC/ΔIEC; Apc min/+ mice (n=19). (D) Gross images and weight of the spleen obtained from Pten +/+; Apc min/+ and Pten ΔIEC/ΔIEC; Apc min/+ mice (n=5/group). (E) The mouse mortality was evaluated between Pten +/+; Apc min/+ (n=25) and Pten ΔIEC/ΔIEC; Apc min/+ mice (n=23) over 5 months after birth. Difference in survival was shown by Kaplan-Meier plot. The log-rank (Mantel-Cox) test was used to compare significant survival difference (P< 0.0001). Data were analyzed with the results accumulated by 5 independent experiments. Presented are the representative images. ** P<0.01, *** P<0.001 (Mann-Whitney U test).
