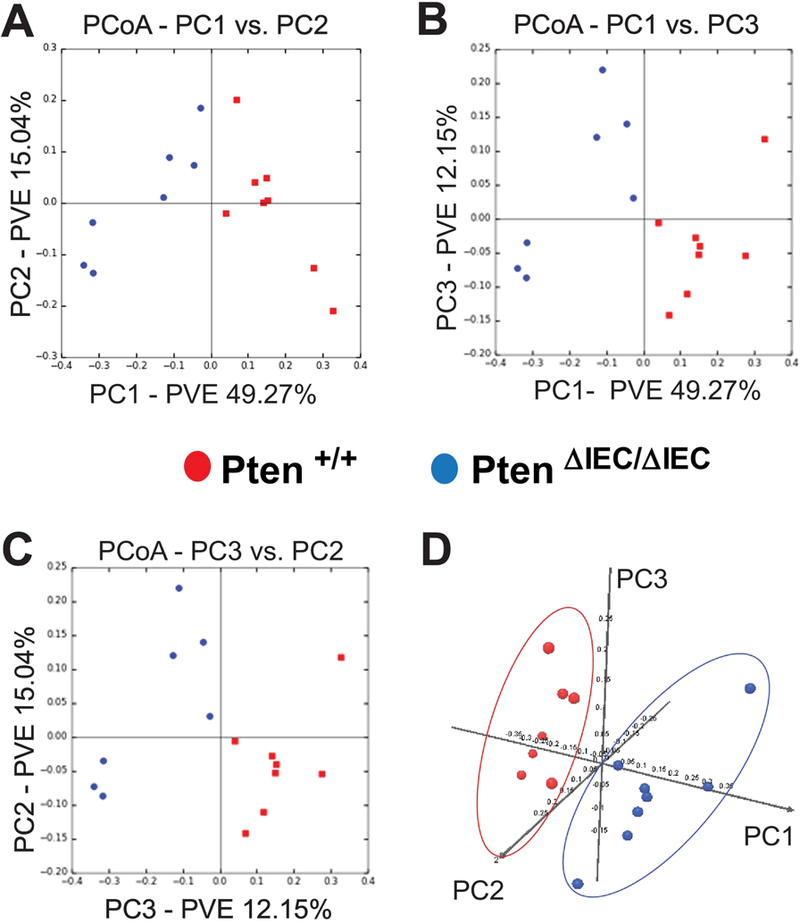
Figure 5: The fecal microbiome of Pten ΔIEC/ΔIEC mice was distinct from that of Pten +/+ mice.

The bacterial community structure of the fecal samples from Pten +/+ and Pten ΔIEC/ΔIEC mice was analyzed using weighted UniFrac distance matrices. (A to C) Principal coordinate analysis plots represent the three highest discriminating axes. The primary vector PC1 explains 49.27% of the variation between the groups, while PC2 and PC3 represent 15.04% and 12.15%, respectively. PVE, percent variance explained. (D) The first three vectors together exhibit 76.4% of the variation among the groups. Each dot represents individual microbiota samples from the mouse. (n=8/each group).
