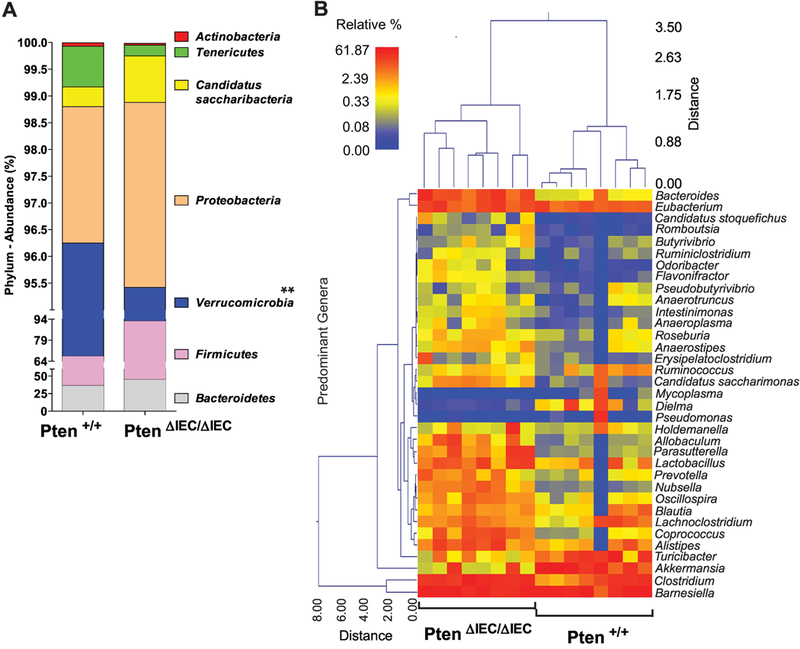
Figure 6: Relative abundance of taxonomic groups observed in the fecal samples were different between Pten ΔIEC/ΔIEC and Pten +/+ mice.

(A) The abundance (% of sequences) of the phyla detected in the fecal samples of Pten ΔIEC/ΔIEC and Pten +/+ mice. Bacteroidetes, Firmicutes, Verrucomicrobia, and Proteobacteria are the 4 major phyla encompassing the majority of sequences (> 98.7 %). A statistically significant difference between the groups was identified in Verrucomicrobia. ** P<0.01 (Mann-Whitney U test). (B) A dual hierarchal dendrogram was generated based on the predominant genera using Ward’s minimum variance clustering and Manhattan distances. Samples with more similar microbial populations are mathematically clustered closer together. The samples with a more similar consortium of genera cluster closer together with the length of connecting lines (top of heatmap) related to the similarity; shorter lines between two samples indicate closely matched microbial consortia. The heatmap represents the relative percentages of each genus. The legend for the heatmap is provided in the upper left corner. The predominant genera are represented along the right Y-axis.
