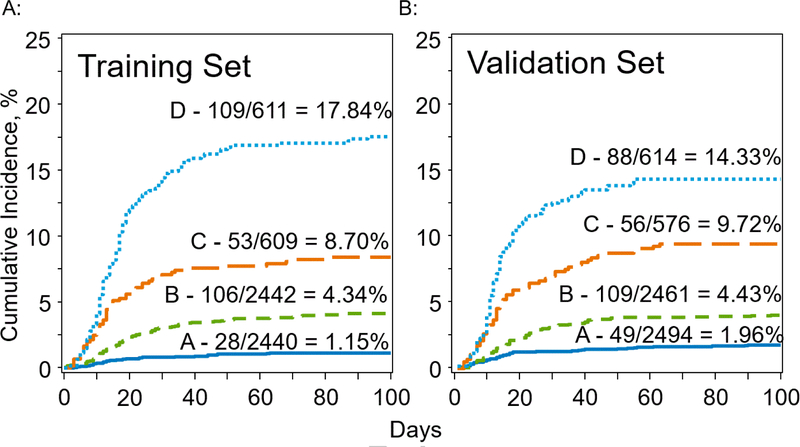
Figure 2A, 2B: VOD Incidence Among Four Risk Groups in Training and Validation Cohorts.
Figure 2A shows the incidence of VOD in the training set for each of the 4 risk groups (A-D). Figure 2B shows the incidence of VOD in the validation set for each of the 4 risk groups (A-D). The curves are labeled with the cumulative incidence by day+100 in each of the 4 risk groups (A-D).

