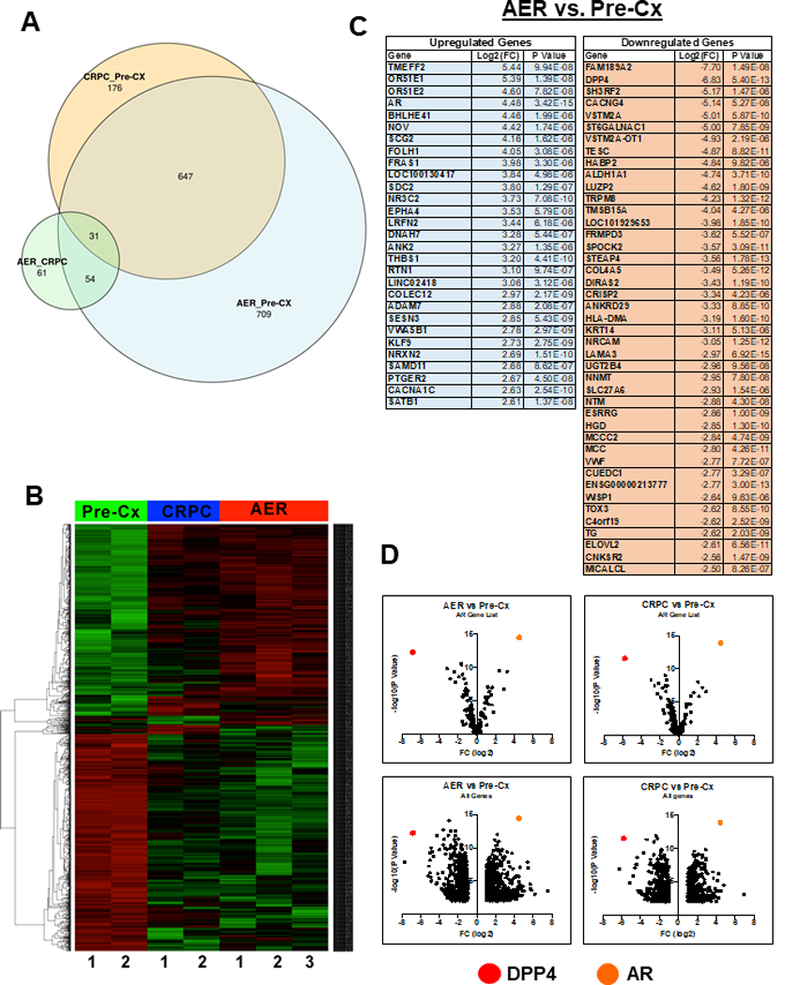
Figure 2. Analysis of RNA-seq from serial biopsies.

A) Venn diagram depicting the overlap between differentially expressed genes in Pre-Cx, CRPC, and AER serial biopsies of 4 different VCaP xenografts. B) Unsupervised clustering of Pre-Cx, CRPC, and AER xenografts based on differential gene expression. C) Differentially expressed genes between AER and Pre-Cx xenografts that meet the stringent criteria of log2FC > 2.5 and P-Value < 1.00×10⁻⁵. D) Volcano plots depicting AR target genes (266 AR gene signature from Mendiratta et al.) (12), supplemented with a selection of DHT-responsive genes from Xu et al. (4) (upper), and all significantly differentially expressed genes (lower) in the AER vs. Pre-Cx and CRPC vs. Pre-Cx comparisons. DPP4 and AR are highlighted.
