
Figure 3.
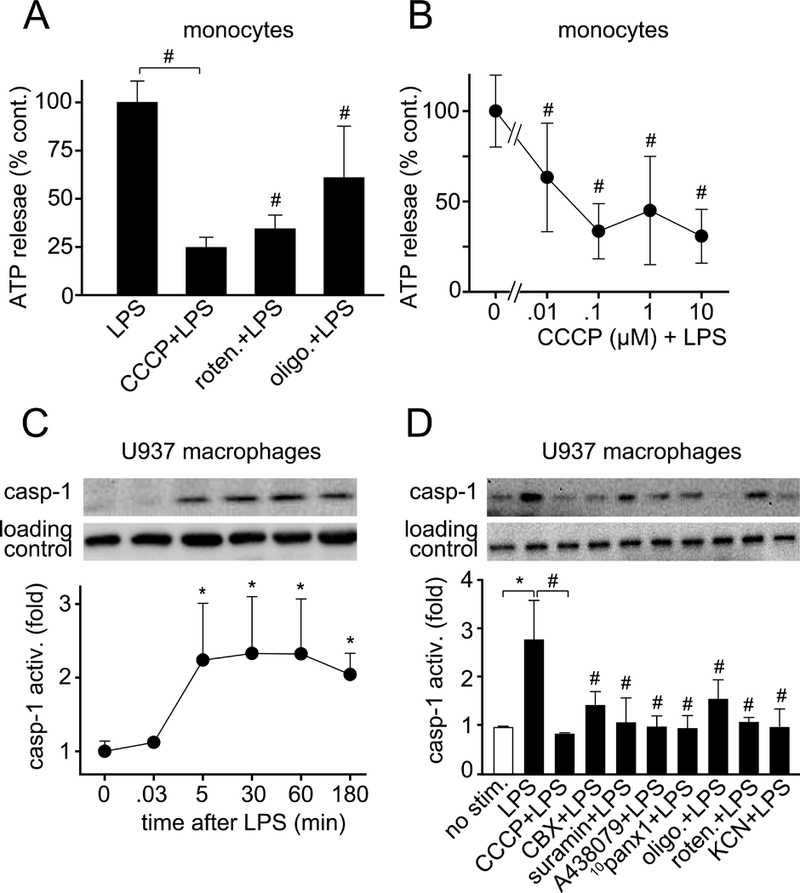
Mitochondrial ATP and autocrine feedback through purinergic receptors are required for LPS-induced caspase-1 activation. A-B, Primary human monocytes were pretreated for 5 min with the mitochondrial inhibitors CCCP (10 μM), rotenone (10 μM), or oligomycin (10 μM; A) or with the indicated concentrations of CCCP (B). Then cells were stimulated with LPS (10 ng/ml) for 5 s and ATP concentrations in the supernatants were determined as described in Fig. 1. Data shown are means ± SD of n=6 (A) or n=3 (B) independent experiments; #P<0.05 compared to LPS-stimulated controls. C, U937 macrophages were stimulated with LPS (1 μg/ml) for the indicated times. Then caspase-1 activation levels were assessed using immunoblotting and antibodies that recognize activated caspase-1 (p20 subunit). D, U937 macrophages were pretreated or not with the mitochondrial inhibitors CCCP (10 μM), rotenone (10 μM), oligomycin (10 μM) or KCN (500 μM), the panx1 channel blockers CBX (100 μM) or 10panx1 (100 μM), or the P2 receptor inhibitors suramin (pan-P2 receptors; 100 μM) or A438079 (P2X7 receptors; 10 μM) for 15 min. Then cells were stimulated with LPS (1 μg/ml) for 2 h and caspase-1 activity was measured. Total p38 MAPK was assessed as loading control. Data shown are mean values ± SD of n=3 separate experiments; *P<0.05 vs. unstimulated negative controls; #P<0.05 vs. LPS-stimulated positive control.