
Figure 3.
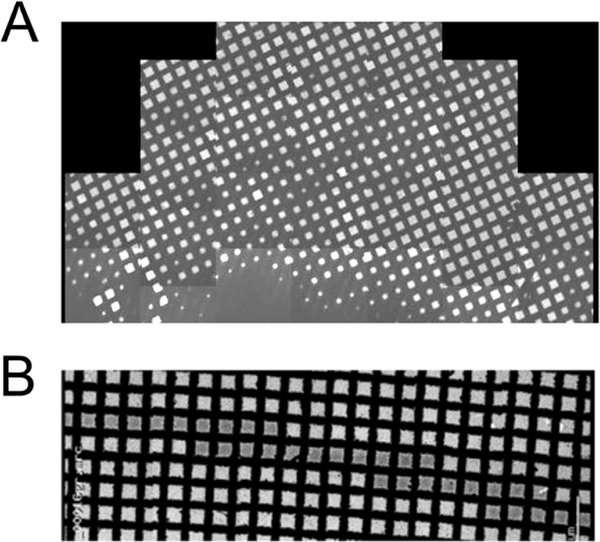
Sample preparation. The figure shows a comparison between a grid vitrified using a standard plunger (top) and a grid prepared using SpotItOn (Jain, et al., 2012) (Razinkov, et al., 2016), bottom. In the grid vitrified with the standard plunger the ice distribution is highly variable across the grid, and identification of suitable areas for data collection can be a lengthy process. In the SpotItOn grid, one single narrow strip of very uniform ice is visible and almost every square in the stripe is available for data collection.