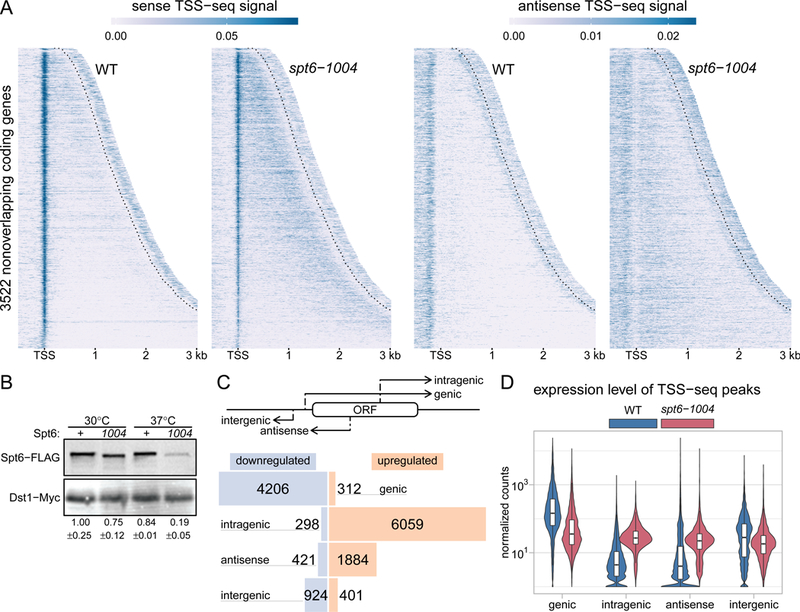
Figure 1.

Spt6 is globally required for normal transcription initiation. (A) Heatmaps of sense and antisense TSS-seq signal in wild-type and spt6-1004 strains, over 3522 non-overlapping genes aligned by wild-type genic TSSs and sorted by length. Data are shown for each gene up to 300 nucleotides 3’ of the cleavage and polyadenylation site (CPS; indicated by the dotted line). Values are the mean of spike-in normalized coverage in non-overlapping 20 nucleotide bins, averaged over two replicates. Values above the 95th percentile are set to the 95th percentile for visualization. (B) Western blot showing levels of Spt6 protein in wild-type and spt6-1004 at 30˚C and after an 80-minute shift to 37˚C. Protein levels were quantified using anti-FLAG antibody to detect Spt6 and anti-Myc to detect Dst1 from a spike-in strain (see Methods). The numbers below the blot show the mean and standard deviation for three Westerns. (C) The diagram at the top illustrates the different classes of TSSs. The bar plot below shows the number of TSS-seq peaks differentially expressed from DESeq2 in spt6-1004 versus wild-type (see Methods), classified by genomic region. Blue bars indicate downregulated peaks and orange bars indicate upregulated peaks. (D) Violin plots showing the expression level distributions for different genomic classes of TSS-seq peaks in wild-type and spt6-1004 strains. Values are the mean of counts from two replicates, normalized using an S. pombe spike-in (see Methods).
