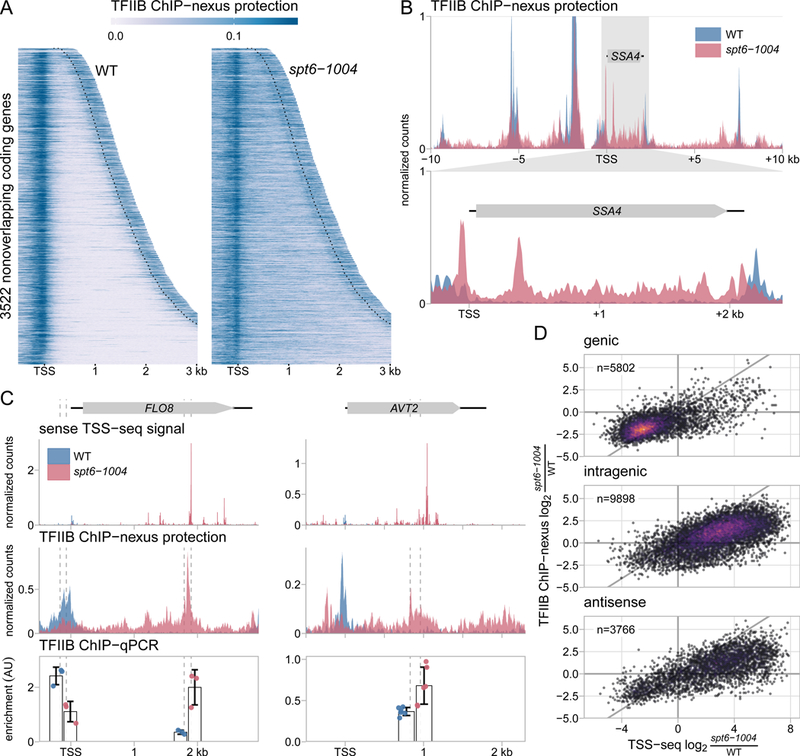
Figure 2.

Spt6 is required for genome-wide localization of TFIIB. (A) Heatmaps of TFIIB binding as measured by ChIP-nexus in wild-type and spt6-1004 strains, over the same regions shown in Figure 1A. The values are the mean of library-size normalized coverage in 20 basepair windows, averaged over two replicates. The position of the CPS is shown by the dotted lines. Values above the 85th percentile are set to the 85th percentile for visualization. (B) The upper panel shows TFIIB binding in wild-type and spt6-1004 strains over 20 kb of chromosome II flanking the SSA4 gene, as measured by TFIIB ChIP-nexus. The lower panel shows an expanded view of TFIIB binding over the SSA4 gene. (C) TSS-seq, TFIIB ChIP-nexus, and TFIIB ChIP-qPCR measurements at the genic and intragenic promoters of the FLO8 and AVT2 genes in wild-type and spt6-1004 strains. TSS-seq counts are normalized to spike-in, ChIP-nexus values are normalized to library size, and ChIP-qPCR is normalized to amplification of a region of the S. pombe pma1+ gene used as a spike-in control. Vertical dashed lines represent the coordinates of qPCR amplicon boundaries. (D) Scatterplots of fold-change in spt6-1004 over wild-type strains, comparing TSS-seq and TFIIB ChIP-nexus. Each dot represents a TSS-seq peak paired with the window extending 200 nucleotides upstream of the TSS-seq peak summit for quantification of TFIIB ChIP-nexus signal. Fold-changes are regularized fold-change estimates from DESeq2, with size factors determined from the S. pombe spike-in (TSS-seq) or the S. cerevisiae counts (ChIP-nexus). The diagonal line is y=x.
