
Figure 6.
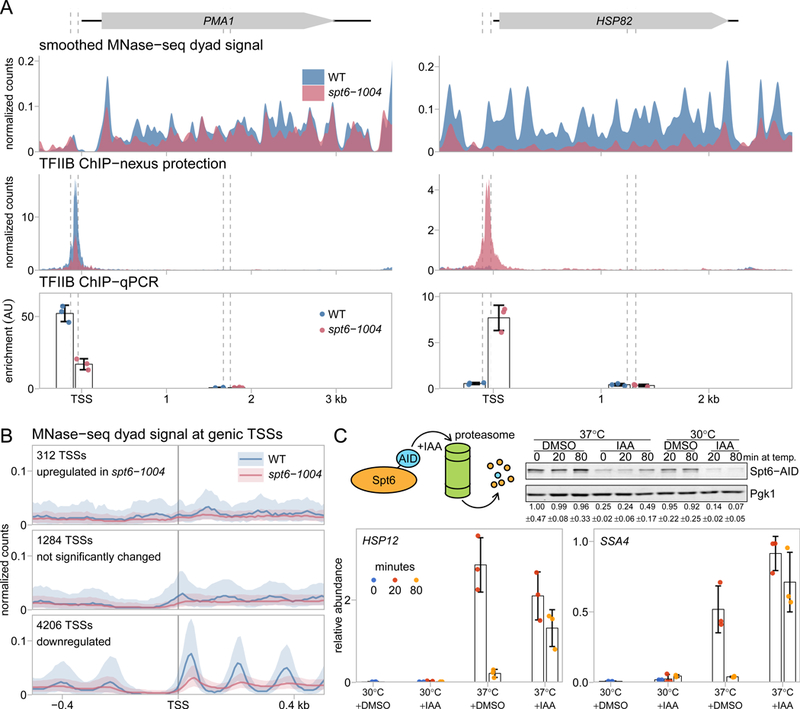
Spt6 function is necessary to control genic transcription. (A) MNase-seq, TFIIB ChIP-nexus, and TFIIB ChIP-qPCR measurements at the PMA1 and HSP82 genes in wild-type and spt6-1004 strains, plotted as in 2B and 4D. For the ChIP-qPCR analysis, the mean and standard deviation are plotted for three experiments. (B) The average MNase-seq dyad signal at genic TSSs in wild-type and spt6-1004 strains, grouped by the differential expression status of the TSS. The solid line and shading represent the median and inter-quartile range. (C) RT-qPCR analysis of HSP12 and SSA4 RNA levels, testing the effects of temperature shift and Spt6 depletion. The top left panel shows a diagram of auxin-dependent degradation system used to deplete Spt6 and the top right panel shows a Western measuring the level of Spt6 protein, with and without depletion. The bottom panels show the RNA levels for HSP12 and SSA4 at times after a temperature shift from 30˚C to 37˚C. In these experiments, either DMSO or IAA were added 30 minutes before the zero time point. Plotted are the mean and standard deviation for three experiments, normalized to SNR190 RNA.