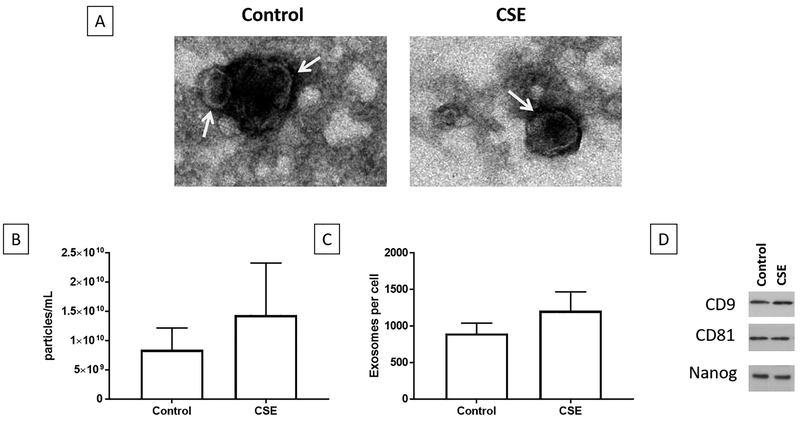
Figure 1: Characterization of control and oxidative stress exosomes.
1A – Transition electron micrograph of control and oxidative stress exosomes show round/cup shaped exosomes
1B – Total number of particles/ml of media show no difference in exosomes between treatments.
1C – Number of exosomes/AEC from both control and oxidative stress treatments were not different.
1D – Both control and oxidative stress derived AEC exosomes showed exosome markers CD9, CD81 and stem cell marker NANOG.

