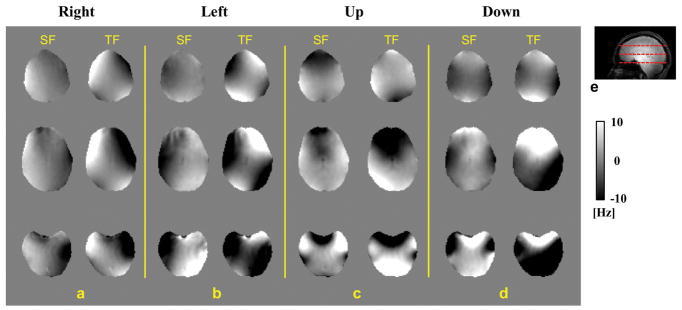
FIG. 1.
a–d: Field difference in the brain of subject #1 in four poses relative to the field in the reference pose in the head frame. The results on the left of each panel are the SF change while the TF change is shown on the right. e: A sagittal image of the subject. Dashed lines indicate the positions of the slices shown in a–d. The field map is presented in the unit of Hz offset from the resonance frequency at 7 T.

