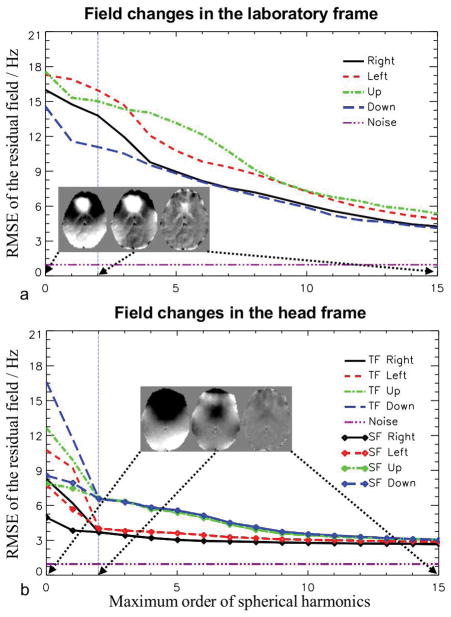
FIG. 3.
RMSEs of the residual, when the field changes in the laboratory frame (a) and head frame (b) were modeled as spherical harmonic expansions, as a function of the maximum order of the harmonics. For the head frame, both TF and SF changes were analyzed. The purple dashed line shows the level of noise in the field measurement. The vertical dashed line marks the second order expansion, illustrating the maximum order of the shim coils on a typical high-field MRI system. The inserts show the TF residual fields of pose “Up” in a slice after the expansions of 0th, 2nd and 15th orders, respectively. The gray scale of the maps ranges from −10 to 10 Hz.

