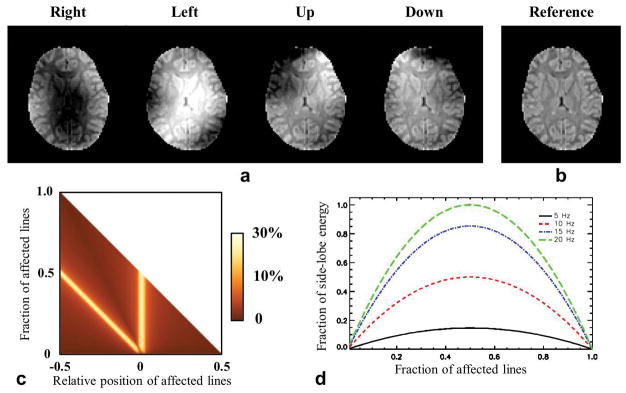
FIG. 4.
Impact of the motion-induced SF change on the synthetic GRE image with TE=25 ms. a: Resultant image magnitudes after two central k-space lines of the reference image (b, in the same color map as a) were replaced by the corresponding lines of the “field-corrupted” images. The data of field change was obtained from the measurement in the middle slice as shown in Fig. 1. c: Summary of NRMSE of corrupted image magnitude as a function of the fraction of affected lines and their relative position in the k-space. d: The FESL curves of the PSF as a function of the fraction of the affected lines and the frequency change.

